It is time now to take a closer look at families in the United States today. Using U.S. census data (U.S. Census Bureau, 2021), we first sketch the major types of family arrangements that now exist.
Marriage
The census defines a as being all the people who live together in a dwelling unit, whether or not they are related by blood, marriage, or adoption. About 128.4 million households exist in the United States. Of this number, about 65% are family households and 35% are nonfamily households. Most of the nonfamily households consist of only one person. About 48.5% of all households involve a married couple, and half do not involve a married couple.
.
|
Think Like a Sociologist |
|
We’ve been studying both families and households. People seldom ever think about the differences between the two. However, sociologists make sure to understand them as two different concepts. Take a second to think about both concepts.
Who or what (pets?) would you include if you had to list members of your family? Now, list all the people who live in your household. Are those two groups exactly the same? What does this tell you about the similarities and differences between families and households? |

.
This last figure should not suggest that marriage is unimportant. Only 29.5% of all adults (18 or older) have never been married, about 54.6% are currently married, 10.1% are divorced, and 5.8% are widowed (see Figure 12.5 “Marital Status of the U.S. Population, 2021, Persons 15 Years of Age or Older”). Because more than half of the never-married people are under 30, it is fair to say that many of them will be getting married sometime in the future. When we look just at people aged 45–54, about 88% are currently married or had been married at some point in their lives. These figures all indicate that marriage remains an important ideal in American life, even if not all marriages succeed.
Figure 12.5 Marital Status of the U.S. Population, 2021, Persons 15 Years of Age and Older

Source: US Census Bureau, America’s Families and Living Arrangements: 2021, https://www.census.gov/data/tables/2021/demo/families/cps-2021.html.
Approval of interracial marriage has increased from 4%, in 1961, to 94%, in 2021 (McCarthy, 2021). Despite this, the overwhelming majority of married-couple households are , or between people of the same race or ethnicity. In 2020, only about 10% of married-couple households were , or between people of different races or ethnicities (Statista, 2022). As small as it is, the rate of interracial and interethnic marriage is significantly greater than the 1.3% of marriages in 1980 that were classified as such. Moreover, 1 in 6 new marriages, are interracial or interethnic (Livingston and Brown, 2017).

Although only 10% of marriages are between people of different races and/or ethnicities, this figure is about 8 times greater than the proportion of similar marriages in 1980. Jennifer Borget – CC BY-NC-ND 2.0
Rates of intermarriage, however, vary by region, with 42% of newlyweds in Honolulu, Hawaii marrying across racial or ethnic lines, compared to the 3% of couples in Asheville, North Carolina and Jackson, Mississippi who did so (Alberti, 2017). Interracial and interethnic marriage varies by racial-ethnic group, as well, with 29% of Asians, 27% of Latinx, 18% of African American and 11% of white newlyweds intermarried (Alberti, 2017). There is variation when it comes to gender, with African American men being twice as likely to intermarry than African American women (24% versus 12%), while Asian Americans experience the reverse, with 36% of female Asian American newlyweds intermarrying, compared to the 21% of Asian American men who intermarried (Alberti, 2017). Rates of intermarriage are higher among people who are college-educated, live in metropolitan areas and are under the age of 50. The change in rates of intermarriage relates largely to increased diversity within U.S. society and increased acceptance of intermarriage within families.
Figure 12.6 Median Age at First Marriage for Men and Women, 1890–2020

Source: Data from U.S. Census Bureau. (2020). Estimated median age at first marriage, by sex: 1890 to the present. Retrieved from https://www.census.gov/data/tables/time-series/demo/families/marital.html.
It is interesting to see how the age at which people first get married has changed. Figure 12.6 “Median Age at First Marriage for Men and Women, 1890–2020” above, shows that age at first marriage declined gradually during the first half of the 20th century, before dropping more sharply between 1940 and 1950 because of World War II. It then rose after 1970 and today stands at 30.5 years for men and just over 28 years for women.
.
|
Using Your Sociological Imagination |
|
Public Domain – publicdomainq.net If you look at Figure 12.6, it’s pretty clear that people in the U.S. are waiting longer before they get married, which has been trending since th1950s after it dipped down because of World War II. The downward trend during and following World War II is largely explained, by the number of young men who were going off to, and returning from, the war. First, many young men were getting married before going off to war. Some speculate that it was because they wanted to hedge their bets about returning to find their fiancé married to someone else (or, perhaps, returning, at all). Second, upon returning from war, men were encouraged to form families and buy houses thanks to benefits available in the newly crafted GI Bill. But the US has experienced a lot of change since then. One such change is that we started to depend more on service sector jobs rather than manufacturing jobs, and this brought with it several very important trends, two of which are: 1) more and more women started to enter into the formal economy; and 2) many service jobs required post-secondary training. How do you suppose the changes mentioned above (as well as a few more discussed in Chapter 10) have contributed to the trend in the increasing age of marriage since the 1950s? |

.
The United States Compared with Other Postindustrial Nations
In many ways, the United States differs from other postindustrial democracies in its view of marriage and in its behavior involving marriage and other intimate relationships (Cherlin, 2010; Hull, Meier, & Ortyl, 2010). First, Americans place more emphasis than their postindustrial counterparts on the ideal of romantic love as a basis for marriage and other intimate relationships and on the cultural importance of marriage. Second, the United States has higher rates of marriage than other postindustrial nations. Third, the United States also has higher rates of divorce than other postindustrial nations; for example, 42% of American marriages end in divorce after 15 years, compared to only 8% in Italy and Spain. Fourth, Americans are much more likely than other postindustrial citizens to remarry once they are divorced, to cohabit in short-term relationships, and, in general, to move from one intimate relationship to another, a practice called .
The U.S. emphasis on romantic love helps account for its high rates of marriage, divorce, and serial monogamy. It leads people to want to be in an intimate relationship, married or cohabiting. Then, when couples get married because they are in love, many quickly find that passionate romantic love can quickly fade; because their expectations of romantic love were so high, they become more disenchanted once this happens and unhappy in their marriage. The American emphasis on independence and individualism also makes divorce more likely than in other nations; if a marriage is not good for us, we do what is best for us as individuals and end the marriage. As Andrew J. Cherlin (2010, p. 4) observes, “Americans are conflicted about lifelong marriage: they value the stability and security of marriage, but they tend to believe that individuals who are unhappy with their marriages should be allowed to end them.” Still, the ideal of romantic love persists even after divorce, leading to remarriage and/or other intimate relationships.
.
|
Using Your Sociological Imagination |
|
Prior to industrialization in the U.S., arranged marriages were common. AnyJazz – CC BY 2.0 – Flickr We tend to take for granted that love is what drives marriage in the US. In other words, people in the US get married because they fall in love with one another. The truth is that, for the most part, people do. However, you might be surprised to hear that this wasn’t always the case. In fact, the idea that marriage is based on mutual love between spouses is a relatively recent cultural innovation that developed with industrialization. Before the US industrialized, our socio-economic structure was based largely on agriculture, and our agricultural economy was largely family-based. That means that each family was like a business that produced, sold and traded products. Families were extended to the point they included immediate family members, kin, and even people who weren’t related by blood. Children were regarded more like mini adults who contributed to family businesses. So, it makes sense that marriages were more like business ventures than relations between two people who fall hopelessly in love with one another. For instance, if a family owned and operated a grain mill, it might collectively decide that it was a good idea for one of the children to marry a person from a family that produced grain. That’s a great business deal, right? And what a better legal partnership between two businesses than a marriage? Arranged marriages prevalent in some parts of the world. Watch the following short video, in which the pros and cons of arranged marriage and romantic love marriages are discussed. How would you feel if your parents or family got together and decided who you were going to marry? Would you trust their judgment about a potential spouse? |

.
Families and Children in the United States
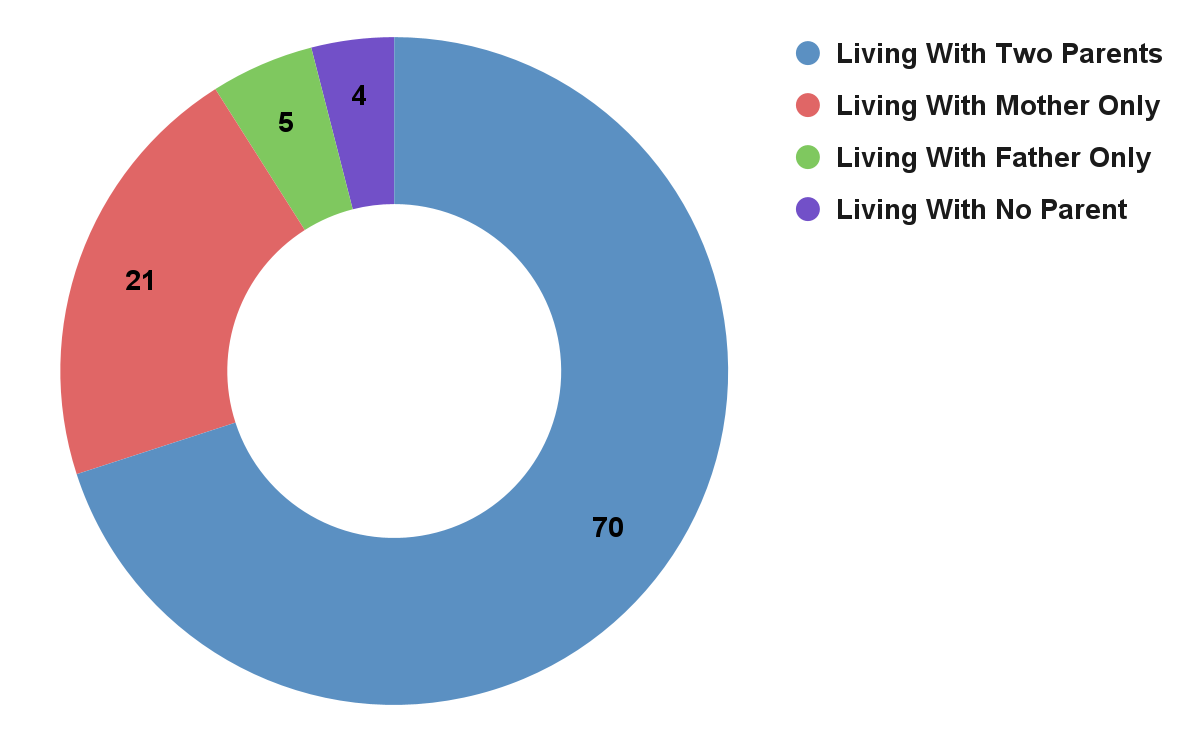
The United States has about 33.5 million families with children under 18. About 70.5% of these are married-couple families, while 30% (up from about 14% in the 1950s) are one-parent families. About 80% of these latter families are headed by the mother. There are about 72.9 million children under the age of 18 living in the United States, of whom about 70.4% live with 2 parents (married or not) (see Figure 12.7 “Living Arrangements of Children Under 18, 2020”).
Figure 12.7 Living Arrangements of Children Under 18, 2020
Source: Census.gov – Table C3. Living Arrangements of Children Under 18 Years and Marital Status of Parents, by Age, Sex, Race, and Hispanic Origin and Selected Characteristics of the Child for All Children: 2020. https://www2.census.gov › programs-surveys › demo › tables › families › 2019 › cps-2019 › tabc3-all.xls.
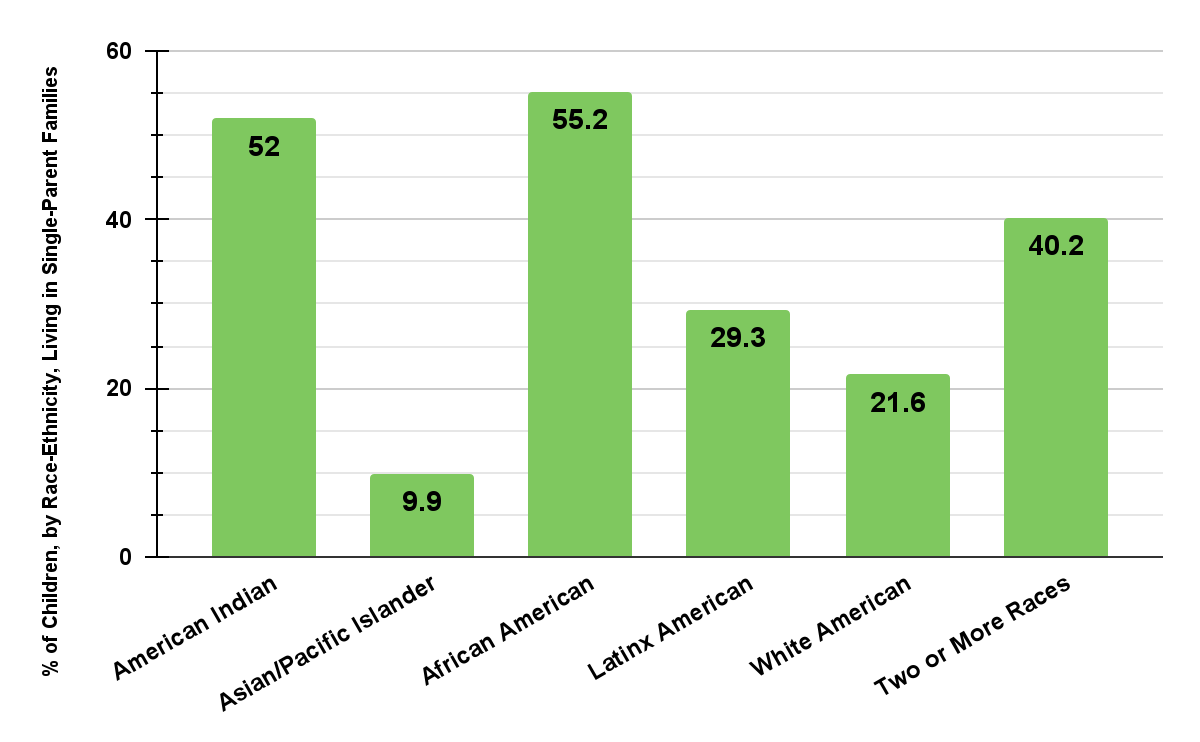
The proportion of families with children under 18 that have only one parent varies significantly by race and ethnicity: Latinx, American Indian and African American families are more likely than white and Asian American households to have only one parent (see Figure 12.8 “Children in Single-Parent Families by Race, 2020”).
Figure 12.8 Children in Single-Parent Families by Race, 2020
Source: Census.gov – C3. Living Arrangements of Children Under 18 Years1 and Marital Status of Parents, by Age, Sex, Race, and Hispanic Origin2 and Selected Characteristics of the Child for All Children: 2020. Source: The Annie E. Casey Foundation, 2022, Children in single-parent families by race in the United States, https://datacenter.kidscount.org/data/tables/107-children-in-single-parent-families-by-race#detailed/1/any/false/1729/10,11,9,12,1,185,13/432,431.
We discuss single-parent families and racial and ethnic differences in family arrangements at greater length a little later, and we will also discuss several other issues affecting children. But before we leave the topic of children, it is worth noting that children, despite all the joy and fulfillment they so often bring to parents, also tend to reduce parents’ emotional well-being. As a recent review summarized the evidence, “Parents in the United States experience depression and emotional distress more often than their childless adult counterparts. Parents of young children report far more depression, emotional distress and other negative emotions than non-parents, and parents of grown children have no better well-being than adults who never had children” (Simon, 2008, p. 41).
Children have these effects because raising them can be both stressful and expensive. Depending on household income, the average child costs parents between $134,000 and $270,000 from birth until age 18. College education obviously can cost tens of thousands of dollars beyond that. Robin W. Simon (2008) argues that American parents’ stress would be reduced if the government provided better and more affordable day care and after-school options, flexible work schedules, and tax credits for various parenting costs. She also thinks that the expectations Americans have of the joy of parenthood are unrealistically positive and that parental stress would be reduced if expectations became more realistic.
Test Yourself
Section 12.3 References
Alberti, D. (2017, May 18) Intermarriage across the U.S. by Metro Area. Pew Research Center’s Social & Demographic Trends Project, Pew Research Center’s Social & Demographic Trends Project. Retrieved from www.pewsocialtrends.org/interactives/intermarriage-across-the-u-s-by-metro-area/.
Cherlin, A. J. (2010). The marriage-go-round: The state of marriage and the family in America today. New York, NY: Vintage.
Hull, K. E., A. Meier and T. Ortyl. (2010). The changing landscape of love and marriage. Contexts, 9(2), 32–37.
Livingston, G. and A. Brown. (2017, May 18). Intermarriage in the U.S. 50 Years After Loving v. Virginia. Pew Research Center. Retrieved from https://www.pewresearch.org/social-trends/2017/05/18/intermarriage-in-the-u-s-50-years-after-loving-v-virginia/.
Love or arranged marriages, which is better? (2020, July 30). YouTube. Retrieved from https://youtu.be/-mhMVhQY56A.
McCarthy, J. (2021). U.S. Approval of Interracial Marriage at New High of 94%. Gallup.com. Retrieved from https://news.gallup.com/poll/354638/approval-interracial-marriage-new-high.aspx.
Simon, R. W. (2008). The joys of parenthood, reconsidered. Contexts, 7(2), 40–45.
Statista. (2022). Number of married couples in the United States in 2020, by ethnic group and origin of spouses. Statista. Retrieved from https://www.statista.com/statistics/242028/number-of-married-couples-in-the-us-by-ethnic-group-and-combination/.
US Census Bureau. (2021). America’s Families and Living Arrangements: 2021. Retrieved from https://www.census.gov/data/tables/2021/demo/families/cps-2021.html.
U.S. Census Bureau. (2020). Estimated median age at first marriage, by sex: 1890 to the present. Retrieved from https://www.census.gov/data/tables/time-series/demo/families/marital.html.
CC licensed content, Shared previously and Adapted
Barr, Scott, Sarah Hoiland, Shailaja Menon, Cathay Matresse, Florencia Silverira and Rebecca Vonderhaar. (n.d.). Introduction to Sociology. Introduction to Sociology | Simple Book Production. Lumen Learning. License: CC BY 4.0. License Terms: Access for free at https://courses.lumenlearning.com/wm-introductiontosociology/.
Conerly, Tonja, Kathleen Holmes, Asha Lal Tamang, Jennifer Hensley, Jennifer L. Trost, Pamela Alcasey, Kate McGonigal, Heather Griffiths, Nathan Keirns, Eric Strayer, Tommy Sadler, Susan Cody-Rydzewski, Gail Scaramuzzo, Sally Vyain, Jeff Bry and Faye Jones. (2021). Introduction to Sociology 3E. OpenStax. Houston, TX. License: CC BY 4.0. License Terms: Access for free at https://openstax.org/books/introduction-sociology-3e/pages/1-introduction.
Griffiths, Heather, Nathan Keirns, Eric Stayer, Susan Cody-Rydzewski, Gail Scaramuzzo, Tommy Sadler, Sally Vyain, Jeff Bry and Faye Jones. (2015). Introduction to Sociology 2E. OpenStax. Houston, TX. License: CC BY 4.0. License Terms: Access for free at https://openstax.org/books/introduction-sociology-2e/pages/1-introduction-to-sociology.
Saylor Foundation. (2015). Social Problems: Continuity and Change. License: CC BY-NC-SA 3.0. License Terms: Access for free at https://saylordotorg.github.io/text_social-problems-continuity-and-change/.
people who live together in a dwelling unit, whether or not they are related by blood, marriage, or adoption
a marriage between people of the same race or ethnicity
a marriage between people of different races and/or ethnicities
to move from one intimate relationship to another in a sequence
