is the outcome when cultural values and gender socialization prioritize the male experience. Similarly, occurs when heterosexuality is presented as the only normal or preferred orientation, resulting in bias and discrimination against LGTBQ+ people. One reason why these forms of inequality persist is because they are part of the social structure within society’s social institutions. First, we examine how gender inequality in education, health care and the workplace affect women, then we look at how sexual minorities’ rights were infringed on by healthcare and limited by the law.
Gender Inequality in Education
As soon as they start attending school, boys and girls are treated differently, with girls’ abilities undervalued and underestimated. For example, one study looked at math scores of children when in kindergarten and then again in third grade. Scores for boys and girls were similar in kindergarten, but the girls’ scores had dropped compared to the boys four years later (Cimpian, 2018). Since the children had come from similar backgrounds, researchers sought an explanation, and found it in their teachers’ expectations of their abilities. Teachers were more likely to see their male students as mathematically gifted – even when the scores for both boys and girls were the same.
Though women can and do rebound from lower expectations about their abilities, they are still aware of such perceptions upon entering college. While more women than men are enrolled in college now, gender tracking causes women to pursue degrees in ‘feminine’ fields. That is, women are not necessarily dissuaded from science or math heavy majors due to their difficulty, but rather they avoid fields where they think they are going to experience discrimination (Cimpian, 2018). Perception of gender make-up in the workplace also influences both women and men, as both are more likely to choose degrees according to how similar they think they would be to others working in that field (Cheryan, 2010). Women who persevere to earn a degree in math or science and choose to attain a postgraduate degree face harsh scrutiny; they are seen as less brilliant than male peers, judged for their looks, and get less credit for co-authored publications (Cimpian, 2018).
Gender Inequality in Health Care
Gender bias in health care has resulted in poor care and worse outcomes for women (Alspach, 2012). Women die at higher rates from cardiovascular disease than men because they are less likely to receive known treatments and more likely to have their symptoms dismissed (as acid reflux or the flu) (Alabas, 2017). Women are more likely to be diagnosed with depression than men, while men are more likely to be diagnosed with antisocial disorder than women, even though rates of mental illness are the same for both genders (WHO, n.d.). Pain in women is perceived differently and treated less seriously than men’s pain (Samulowitz, 2018).
The dearth of women as subjects in research studies is also troubling. As recently as 2010, just 28% of 800 biological studies included women. While by 2019 the numbers had increased to near parity, what still concerns some is the lack of clarity about how many women exactly had been included in such studies. Few studies where women are the only participants are done (Flaherty, 2020). Since women’s health presents differently than men – for example, women’s heart attack symptoms are different than men’s – a lack of interest in understanding female biology has significant consequences.
.
|
Think Like a Sociologist |
|
A study from Sweden illustrates the need to validate women’s experiences. Cities in Sweden typically cleared the snow from major roadways first, then progressed from main streets to side streets and finally clearing sidewalks and bike paths last. Researchers studied driving patterns, though, and found that women and men drive differently. Men were more likely to drive directly from home to work; women tended to make a number of stops en route to the store, daycare provider, family member and other errands. The women were thus more likely to encounter snow covered side streets and sidewalks – and have more slip and fall accidents as a result. By reversing the order of what got plowed first, the number of costly trips to the emergency department declined. And because there were fewer working women injured, there was less impact to the economy, too (Perez, 2019). Can you think of other ways in which social institutions are structured to inconvenience or endanger women due to the roles they play? |
.
Gender Inequality in the Workplace
In the last few decades, women have entered the workplace in increasing numbers, both out of economic necessity and a desire for the sense of self-worth and other fulfillment that comes with work. This is true not only in the United States but also in many other nations. In 2019, 57.4% of U.S. women aged 16 or older were in the labor force, compared to only 43.3% in 1970; comparable figures for men were 69.2% in 2019 and 79.7% in 1970 (Catalyst, 2020). Thus, while women’s labor force participation continues to lag behind men’s, the gap has narrowed. The figures cited include women of retirement age. When we just look at younger women, labor force participation is even higher. For example, 82.9% of women aged 35–44 were in the labor force in 2019, compared to only 46.8% in 1970 (Bureau of Labor Statistics, 2019).
Figure 10.5 Women’s Earnings as a Percentage of Men’s Earnings, 2016
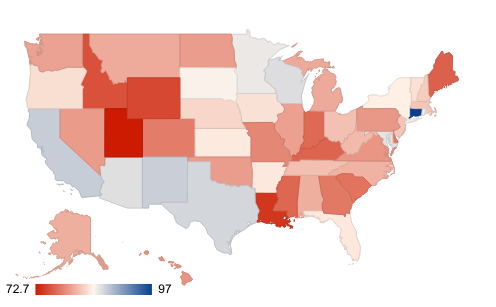
Source: U.S. Bureau of Labor Statistics Reports, Report 1094. (September 2021). Highlights of Women’s Earnings in 2020. Data retrieved from : https://www.bls.gov/opub/reports/womens-earnings/2020/pdf/home.pdf
Despite the inroads women have made, problems persist, with the greatest being the gender pay gap. Women have earned less money than men ever since records started being kept (Reskin & Padavic, 2002). In the United States in the early 1800s, full-time women workers in agriculture and manufacturing earned less than 38% of what men earned. By 1885, they were earning about 50% of what men earned in manufacturing jobs. As the 1980s began, full-time women workers’ median weekly earnings were about 65% of men. Women have narrowed the gender gap in earnings since then: their weekly earnings in 2019 were 82% of men among full-time workers (Catalyst, 2020). This means, on average, that for every $10,000 men earn, women earn only about $8,200. For the average worker, this gap amounts to more than $500,000 over a lifetime of working. Of course, this gap varies across states. As shown in Figure 10.5 “Women’s Earnings as a Percentage of Men’s Earnings, 2020”, Connecticut has the country’s smallest pay gap at 97%, while at 72.7%, Utah has the highest gap in pay between women and men. To learn more about the pay gap in your state, check out this website: https://www.aauw.org/resources/article/gender-pay-gap-by-state/.
.
|
Think Like a Sociologist |
||||||||||||||||||||||||
|
Consider this chart of occupations with the highest pay gaps between men and women. Occupations with a pay gap below 100% favor men over women, and conversely, a pay gap over 100% favors women over men. Of the more than 500 occupations listed by the U.S. Bureau of Labor Statistics, there are only 5 in which women out earn men. Why do you think men in these jobs receive higher pay?
Source: U.S. Bureau of Labor Statistics Reports, Report 1094. (September 2021). Highlights of Women’s Earnings in 2020. Data retrieved from : https://www.bls.gov/opub/reports/womens-earnings/2020/pdf/home.pdf |
.
As Table 10.1 “Median Annual Earnings of Full-Time, Year-Round Workers Aged 25–64 by Educational Attainment, 2020” shows, this gender gap exists for all levels of education. On the average, women with a bachelor’s degree or higher and working full time earn more than $21,000 less per year than their male counterparts. Another note to make is that as the degree level is correlated with the size of the wage gap – as the degree increases, so does the size of the wage gap.
Table 10.1 Median Annual Earnings of Full-Time, Year-Round Workers Aged 25 and Older by Educational Attainment, 2020
|
|
Less than a High School Diploma |
High School Graduate, No College |
Some College or Associate’s Degree |
Bachelor’s Degree or Higher |
|
Men |
$35,048 |
$45,812 |
$53,404 |
$85,488 |
|
Women |
$27,300 |
$34,893 |
$40,508 |
$64,428 |
|
$ Differences (men – women) |
-$7,748 |
-$10,919 |
-$12,896 |
-$21,060 |
|
Gender Gap (women ÷ men) |
77.9% |
76.2% |
75.9% |
75.4% |
Source: U.S. Bureau of Labor Statistics Reports, Report 1094. (September 2021). Highlights of Women’s Earnings in 2020. Data retrieved from : https://www.bls.gov/opub/reports/womens-earnings/2020/pdf/home.pdf
What accounts for the gender gap in earnings? The first major reason is in the workplace, which accounts for up to 45% of the gender gap (Reskin & Padavic 2002). Although women have increased their labor force participation, the workplace remains segregated by gender. Almost half of all women work in a few low paying clerical and service (e.g., waitressing) jobs, while men work in a much greater variety of jobs, including high-paying ones. Table 10.2 “Gender Segregation in the Workplace for Selected Occupations, 2020” shows that many jobs are composed primarily of women or of men. Part of the reason for this segregation is that socialization affects what jobs young men and women choose to pursue, and part of the reason is that women and men do not want to encounter difficulties they may experience if they took a job traditionally assigned to the other sex.
Table 10.2 Gender Segregation in the Workplace for Selected Occupations, 2020
|
Occupation |
% Female Workers |
% Male Workers |
Median Pay 2020 |
|
Occupations Predominantly Worked by Females |
|||
|
Preschool & Kindergarten teachers |
98.8 |
1.2 |
$31,430 |
|
Speech-language pathologists |
94.4 |
5.6 |
$80,480 |
|
Dental Hygienists |
93.9 |
6.1 |
$77,090 |
|
Receptionists |
88.3 |
11.7 |
$35,920 |
|
Secretaries & Administrative Assistants |
83.9 |
16.1 |
$31,110 |
|
Registered nurses |
87.4 |
12.6 |
$75,330 |
|
Social Workers |
85.4 |
14.6 |
$51,760 |
|
Food servers (waiters/waitresses) |
70.0 |
30.0 |
$23,740 |
|
Occupations Predominantly Worked by Males |
|||
|
Physicians |
40.6 |
59.4 |
$208,000 |
|
Lawyers |
37.4 |
62.6 |
$126,930 |
|
Chief Executives |
29.3 |
70.7 |
$185,950 |
|
Dentists |
28.7 |
71.3 |
$183,300 |
|
Architects |
28.2 |
71.8 |
$82,320 |
|
Computer software engineers |
19.4 |
80.6 |
$103,590 |
|
Police Officers |
17.1 |
89.2 |
$67,290 |
|
Mechanical Engineers |
8.7 |
91.3 |
$90,160 |
|
Carpenters |
3.2 |
96.8 |
$49,520 |
|
Electricians |
3.1 |
96.9 |
$56,900 |
Source: Data from “Employed Persons by Detailed Occupation, Sex, Race, and Hispanic or Latino Ethnicity.” U.S. Bureau of Labor Statistics, U.S. Bureau of Labor Statistics, 22 Jan. 2021 https://www.bls.gov/cps/cpsaat11.htm
A second reason for the gender wage gap is that employers associated with sex-segregated jobs discriminate against applicants who are not the “right” sex for that job. Employers may either consciously refuse to hire someone who is the “wrong” sex for the job or have job requirements (e.g., height requirements) and workplace rules (e.g., working at night) that unintentionally make it more difficult for women to qualify for certain jobs. Although such practices and requirements are now illegal, they still continue. The sex segregation they help create contributes to the continuing gender gap between female and male workers. Occupations dominated by women tend to have lower wages and salaries. Because women are concentrated in low-paying jobs, their earnings are much lower than men’s (Reskin & Padavic, 2002).
.
|
Using Your Sociological Imagination |
|
Occupational sex segregation refers to the idea that some occupations are overwhelmingly worked by men, and other occupations are overwhelmingly worked by women. Reflect on your career goals below. Why did you decide to pursue this major? Is it the type of work usually associated with your gender, or not? In your college classes, is the gender composition of the courses you are taking in your major reflective of sex segregation in occupations? Go the the Bureau of Labor Statistics to see what percentage of people in this occupation are women: Bureau of Labor Statistics: Employed Persons by Detailed Occupation |
.
This fact raises an important question: why do women’s jobs pay less than men’s jobs? Is it because their jobs are not important and require few skills? The evidence indicates otherwise: women’s work is devalued precisely because it is perceived as women’s work, and women’s jobs thus pay less than men’s jobs because they are women’s jobs (Magnusson, 2009).
Studies of support this argument (Stone & Kuperberg, 2005; Wolford, 2005). Researchers rate various jobs in terms of their requirements and attributes that logically should affect the salaries they offer: the importance of the job, the degree of skill it requires, the level of responsibility it requires, the degree to which the employee must exercise independent judgment, and so forth. They then use these dimensions to determine what salary a job should offer. Some jobs might be “better” on some dimensions and “worse” on others but still end up with the same predicted if everything evens out.
|
Occupation |
Average Salary |
|
Licensed Practical Nurse |
$45,500 |
|
Electrician |
$53,248 |
Some jobs predominantly worked by women pay less than jobs worked by men even though their comparable worth is equal to or even higher than the men’s jobs. For example, LPNs, on average earn almost $8000 less per year than electricians, even though calculations based on comparable worth would predict that a Licensed Practical Nurse should earn at least as much. Source: U.S. Bureau of Labor Statistics Reports, Report 1094. (September 2021). Highlights of Women’s Earnings in 2020. Data retrieved from: https://www.bls.gov/opub/reports/womens-earnings/2020/pdf/home.pdf.
When researchers make their calculations, they find that certain jobs perceived as women’s pay less than men’s even though their comparable worth is equal to or even higher than the men’s jobs. For example, a preschool aide may earn less money than someone in outdoor lawn maintenance, even though calculations based on comparable worth would predict that a preschool aide should earn at least as much (Johnson, 2019). The research demonstrates that, though of comparable worth, jobs usually done by women pay less than jobs usually done by men. Thus, the average working woman would earn several thousand dollars more annually if pay scales were re-evaluated based on comparable worth and women were paid more for their work.
Even when women and men work in the same jobs, women often earn less than men (Sherrill, 2009), and men are more likely than women to hold leadership positions in these occupations. As discussed earlier, Bureau of Labor Statistics data provide ready evidence of the lower incomes women receive even in the same occupations. For example, female financial managers earn only 66.1% of what their male counterparts earn; female physicians earn only 82.4% of what male doctors earn; and female correctional officers experience a wage gap of 69.2% (2021). Even in fields where women are the majority of workers, wage gaps persist. For instance, social workers, who are 86% of workers in this category, earn only 83.1% of their male counterparts. Similarly, for elementary and middle school teachers, a field of work in which women make up almost 80% of the labor force, the wage gap persists at 79.3% (Bureau of Labor Statistics, 2021). When variables like number of years on the job, number of hours worked per week, and size of firm are considered, these disparities diminish but do not disappear altogether, and it is very likely that sex discrimination (conscious or unconscious) by employers accounts for much of the remaining disparity.
Litigation has suggested or revealed specific instances of sex discrimination in earnings and employment. In July 2009, the Dell computer company, without admitting any wrongdoing, agreed to pay $9.1 million to settle a class action lawsuit, brought by former executives that alleged sex discrimination in salaries and promotions (Walsh, 2009). Earlier in the decade, a Florida jury found Outback Steakhouse liable for paying a woman site development assistant only half what it paid a man with the same title. After she trained him, Outback assigned him most of her duties, and when she complained, Outback transferred her to a clerical position. The jury awarded her $2.2 million in compensatory and punitive damages (U.S. Equal Employment Opportunity Commission, 2001). More recently, in 2017 and 2018, numerous lawsuits have been filed against companies such as Nike, Google, Spotify and the Detroit Free Press, alleging violations of equal-pay laws.

Women constitute only about 16% of the top executives in the largest U.S. corporations, and women executives are paid much less than their male counterparts. These disparities reflect a “glass ceiling” that limits women’s opportunities for promotion. Opposite of this is the glass escalator that men jump on, whereby upon entering into an occupation dominated by women, they quickly rise to top positions in that field. Kai Pilger – Pexels
Some of the sex discrimination in employment reflects the existence of two related phenomena, the and the . Women may be promoted in a job only to find they reach an invisible “glass ceiling” beyond which they cannot get promoted, or they may not get promoted in the first place. Of all the businesses listed in the Fortune 500, only 41 are run by women (Hinchliffe, 2021). Of companies in the Russell 3000 index (which lists most of the investigable U.S. stock market) the highest paid women earned 84.6 cents for every dollar the highest paid men earned (Kerber, 2021). Although these disparities stem partly from the fact that women joined the corporate ranks much more recently than men, they also reflect a glass ceiling in the corporate world that prevents qualified women from rising up above a certain level (Hymowitz, 2009). In response to the dearth of women in positions of leadership, many companies sought to rectify the situation only to have women find themselves on what has been termed a . Women are often hired at times when companies are facing crises and doing poorly. They find themselves set up for failure due to a lack of support from the company as well as being held responsible for the company’s troubles – which preceded their hiring (Morgenroth, 2020). This has the inadvertent result of making it appear that women cannot be leaders, when in fact the companies were flailing when they got the jobs. Men, on the other hand, can often ride a “glass escalator” to the top, even in female occupations. An example is seen in K-12 education, where principals typically rise from the ranks of teachers. Although men constitute only about 24% of all public-school teachers, they account for about 48% of all school principals and more than 75% of school superintendents (Maranto, 2018).

In 2018, there were fewer women CEOs in the U.S. than CEOs named either ‘John” or ‘David.’ Steve Jurvetson – Attribution 2.0 Generic (CC BY 2.0) – Flickr
Lastly, researchers find that there is a difference in behavior associated with negotiating salaries and raises between women and men. Women are less likely to negotiate aggressively for higher salaries and raises, and when they do, they are more likely to be perceived negatively by their supervisors (U.S. Department of Labor, 2017). Compounding this, when people change jobs, new employers often use past salaries of a new employee to determine the salary offer they make.
Whatever the reasons for the gender gap in income, the fact that women make so much less than men means that female-headed families are especially likely to be poor. In 2020, about 23.4% of these families lived in poverty, compared to only 4.7% of married-couple families (Shrider, et. al, 2021)). The term refers to the fact that female-headed households are especially likely to be poor. The gendering of poverty in this manner is one of the most significant manifestations of gender inequality in the United States.
Sexual Harassment
Another problem in workplaces and schools is , which, as defined by federal guidelines and legal rulings and statutes, consists of unwelcome sexual advances, requests for sexual favors, or physical conduct of a sexual nature used as a condition of employment or promotion or that interferes with an individual’s job performance and creates an intimidating or hostile environment.

Under criminal investigation, Andrew Cuomo was pressured to resign as the Governor of New York in 2021 or else be impeached after an investigation revealed a consistent pattern of unwanted and inappropriate comments and behaviors with female staff. Pat Arnow – CC BY-SA 2.0 – Wikimedia Commons
Although men can be, and are, sexually harassed, women are more often the targets of sexual harassment, which is often considered a form of violence against women. This gender difference exists for at least two reasons, one cultural and one structural. The cultural reason centers on the depiction of women and the socialization of men. As our discussion of the mass media and gender socialization indicated, women are still depicted in our culture as sexual objects that exist for men’s pleasure. At the same time, our culture socializes men to be sexually assertive. These two cultural beliefs combine to make men believe that they have the right to make verbal and physical advances to women in the workplace. When these advances fall into the guidelines listed here, they become sexual harassment.
The second reason that most targets of sexual harassment are women is more structural. Reflecting the gendered nature of the workplace and of the educational system, typically the men doing the harassment are in a position of power over the women they harass. A male boss harasses a female employee, or a male professor harasses a female student or employee. These men realize that subordinate women may find it difficult to resist their advances for fear of reprisals: a female employee may be fired or not promoted, and a female student may receive a bad grade.
How common is sexual harassment? Studies by Kearl (2019) found 38% of women and 17% of men reported experiencing sexual harassment at work, and that 1 in 7 women and 1 in 17 men have sought new employment as a result of workplace harassment or assault. Over 60% of women say they have experienced unwanted sexual attention, sexual coercion, crude comments or sexist comments at work (Feldblum & Lipnic, 2016). In some industries, 9 of 10 women say they have been sexually harassed (Puente & Kelly, 2018). Yet reporting remains very low; the Feldblum and Lipnic study (2016) found that over 85% of people who have been sexually harassed never file legal charges, and 70% of employees do not even file internal complaints.
Sexual harassment cases continue to make headlines. In recent years, accusations, arrests and trials related to sexual harassment, misconduct, assault and rape associated with abuse committed by numerous high-profile male political leaders, judges, media figures, musicians, athletes and corporate leaders, has resulted in a growing recognition of the pervasiveness of such inequalities. Additionally, reaction to these high-profile cases has helped to fuel the “Me Too” social movement.
Women of Color: A Triple Burden
Multicultural feminism stresses that women of color face difficulties for three reasons: their gender, their race, and, often, their social class, which is more frequently near the bottom of the socioeconomic ladder. They thus face a that manifests itself in many ways.
For example, women of color experience “extra” income inequality. Earlier we discussed the gender gap in earnings, with women earning 82% of what men earn, but women of color face both a gender gap and a racial/ethnic gap. Table 10.3 “The Race-Ethnicity and Gender Gap in Annual Earnings for Full-Time, Year-Round Workers, 2020” depicts this double gap for full-time workers. Women of all racial-ethnic groups, when compared to men from the same group, earn between 79.0 and 92.1% of their male counterparts. The minority status of these women compounds to produce an especially high gap between African American and Latina women and white men: African American women earn only 69% and Latina women earn only 64% of what white men earn.
Table 10.3 The Race-Ethnicity and Gender Gap in Annual Earnings for Full-Time, Year-Round Workers, 2020
|
|
Women’s Annual Earnings by Race-Ethnicity ($) |
% of earnings of males in same racial-ethnic group |
% of earnings of white males |
|
White Americans |
$47,060 |
81.5% |
81.5% |
|
African Americans |
$39,728 |
92.1% |
68.8% |
|
Latina Americans |
$36,660 |
88.5% |
63.5% |
|
Asian Americans |
$59,436 |
79.0% |
103.0% |
Source: U.S. Bureau of Labor Statistics Reports, Report 1094. (September 2021). Highlights of Women’s Earnings in 2020. Data retrieved from: https://www.bls.gov/opub/reports/womens-earnings/2020/pdf/home.pdf
These differences in income mean that African American and Latina women are poorer than white women. We noted earlier that about 23.4% of all female-headed families are poor. This figure masks race/ethnic differences among such families: 19.7% of families headed by non-Hispanic white women and 17.5% of families headed by Asian women are poor, compared to 29.9% of families headed by African American women, 30.1% of families headed by Latina women and (Shah, 2021). While white women are poorer than white men, African American and Latina women are clearly poorer than white and Asian American women.
LGBTQ+ Inequality in the Criminal Justice System
Despite having existed for as long as humans have been humans, in many Western societies, homosexuality was seen as deviant, criminal behavior and prosecuted as such. In the U.S., matters began inauspiciously with the Puritans, who made sodomy, or sexual relations between people of the same sex, punishable by death. In the years to come, punishment was reduced to hard labor, but homosexuality was still illegal, lumped in with other “crimes against nature.” By the early 1900’s, laws changed to target gay men specifically, giving the police and vigilante groups permission to search for, beat, and arrest them (Ma, 2020). Anti-sodomy laws fueled the persecution of homosexuals, leading to the Stonewall Riots in 1969. The Stonewall Riots occurred as a result of a raid on the Stonewall Inn, a bar frequented by gay men in the Greenwich Village neighborhood of Manhattan. These protests gave rise to the modern gay liberation movement and the subsequent fight for LGBTQ+ rights in the late 20th and 21st centuries. Decriminalization of sodomy did not occur until the U.S. Supreme Court decided in the Lawrence v. Texas case in 2003 that anti-sodomy laws were unconstitutional. As of 2020, 17 states still had anti-sodomy laws, despite the Supreme Court ruling (Ma, 2020).

Alan Turing was a brilliant English mathematician, computer programmer, philosopher and theoretical biologist who was instrumental in breaking codes used by Germany during WWII. He was prosecuted in 1952 for homosexual acts and sentenced to chemical castration. Alan Turing died of cyanide poisoning in 1954. Public Domain
Many states still treat LGBTQ+ people as deviant. Trans women get harassed under laws intended to prevent loitering and prosecution. The ‘gay/panic’ defense, which allows murderers to claim they were thrown into a state of diminished capacity when they found out their victim was gay or transgender, is accepted (Ma, 2020). At the same time, lesbians, gays, bisexuals and transsexuals are overrepresented at every stage of the criminal justice system (Jones, 2021). They are arrested more frequently, incarcerated more, and are under supervised conditions at higher rates than the cisgender population (Jones, 2021).
LGBTQ+ Inequality in Housing
Laws protecting the rights of the LGBTQ+ community are uneven. For example, fifty percent of the LGBTQ population lives in states prohibiting housing discrimination based on sexual orientation and gender identity (MAP, 2021). Only 22 states have laws that explicitly prohibits discrimination based on sexual orientation and gender identity, while in 20 states there are no explicit prohibitions in state law (MAP, 2020). Given that the U.S. Department of Housing and Urban Development (HUD) currently interprets the Fair Housing Act’s ban on sex-based discrimination to include discrimination based on sexual orientation and gender identity, the patchwork of policies found in individual states means there is a high probability members of the LGBTQ+ community will have been unfairly evicted, denied housing, or refused the ability to buy or rent housing based on their sexual orientation or gender identity.
LGBTQ+ Inequality in Healthcare
Until the 1970’s, homosexuality was defined as a mental illness in the Diagnostic and Statistical Manual of Mental Disorders (Drescher, 2015). The classification of homosexuality as a mental disorder had a huge impact on both homosexuals as well as the public’s opinions of them; treatments ranged from behavior modification, psychotherapy, hypnosis, electroshock therapy, and lobotomy (Baughey-Gill, 2011). Gay rights activists pushed to have this designation removed due to the stigma it caused, eventually able to convince the American Psychiatric Association to do so in 1973. Subsequent studies have found there is a negative bias in one third of the healthcare community against members of the LGBTQ+ community. And similar to women, LGBTQ+ people are rarely included as subjects in medical studies (Baughey-Gill, 2011).
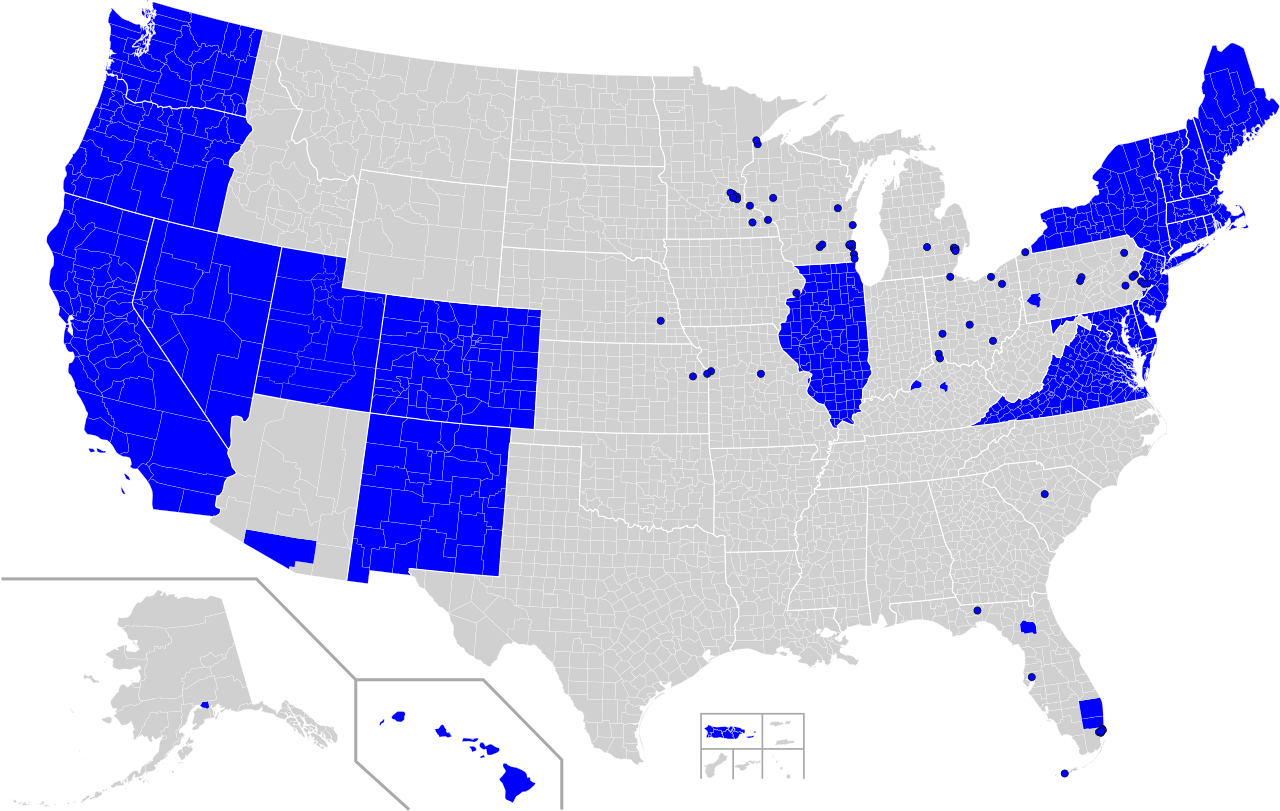
States and counties in blue have banned conversion therapy for minors on the basis of sexual orientation and gender identity. SPQRobin – CC BY-SA 3.0 – Wikimedia Commons
A particularly notorious “treatment” for homosexuality is called conversion therapy, which purports to change a person’s sexual orientation, gender identity or gender expression. Methods are similar to those used as treatment when homosexuality was considered a mental illness, as well as more extreme practices such as prescribing various drugs (ranging from antidepressants to antipsychotics), ritual cleaning, force feeding, forced nudity, forced isolation and confinement (IRCTV, 2021). No credible scientific studies demonstrate that conversion therapy is able to change a person’s sexual orientation, however, research shows it causes considerable harm. LGBTQ+ youth who have undergone conversion therapy are eight times more likely to attempt suicide, five times more likely to be highly depressed, three times more likely to use illegal drugs and three times more likely to be at risk of contracting HIV and sexually transmitted infections compared to LGBTQ youth who did not undergo conversion therapy (GLAAD, 2018).
LGBTQ+ Inequality in the Media
Media presentation of the LGBTQ+ community has a poor track record. In the movies, homosexuality was presented as the object of ridicule and laughter until the 1930’s, where gay characters were seen as the archetypal ‘sissy’ who was nonthreatening. Then, thanks to pressure from religious and women’s groups, the voluntary Hays Code (first implemented in 1934 and used until 1968) changed how homosexuality was presented on screen. Instead of having characters clearly identified as homosexual (though used only for amusement), overt depictions ended. Instead, certain character traits were used to suggest the character’s orientation (MediaSmarts, 2014). The code loosened in the late 1960’s and 1970’s, but now homosexual characters were depicted with a homophobic view, as the characters were dangerous, violent, predatory or suicidal (MediaSmarts, 2014). In the 1990’s, attitudes had changed enough so that mainstream audiences made movies with homosexual storylines successful at the box office, a trend that continued through the early 2000’s. By 2018, representation had improved in the movies, with 18% of the characters identified as LGBTQ, though most were white males, and mostly found in comedies (GLAAD, 2019).
Initially not seen at all on television, after 1970 homosexuality finally was referenced on television, though it was the subject of stereotypes and ridicule, or the characters were seen as asexual beings (Raley, 2006; Fischer 2007). This continued until the 1990’s (Fisher, 2007) when, as occurred in the movies, television programming found room for more gay and lesbian characters (Fisher, 2007). Initially gay and lesbian characters were primarily found in supporting roles and later as the lead character in shows like Will & Grace and Ellen. By 2021, 9% of primetime characters on television were identified as LGBTQ+ (GLAAD, 2021). And although portrayals of gay, lesbian, bisexual and trans characters remains somewhat one-dimensional and stereotypical in traditional media, a greater and more nuanced variety of expression has been found in new forms of media (McInroy, 2016).
Test Yourself
Section 10.3 References
Alabas, O. A, C. P. Gale, M. Hall, M. J. Rutherford, K. Szummer, S. S. Lawesson, J. Alfredsson, B. Lindahl, T. Jernberg. (2017, December 14). Sex Differences in Treatments, Relative Survival, and Excess Mortality Following Acute Myocardial Infarction: National Cohort Study Using the SWEDEHEART Registry. Journal of the American Heart Association, 14;6(12):e007123. Retrieved from https://pubmed.ncbi.nlm.nih.gov/29242184/.
Alspach, J. A. G. (2012, December 1). Is there gender bias in critical care? Critical Care Nurse. Retrieved from https://aacnjournals.org/ccnonline/article/32/6/8/3242/Is-There-Gender-Bias-in-Critical-Care.
Baughey-Gill, S. (2011) When Gay Was Not Okay with the APA: A Historical Overview of Homosexuality and its Status as Mental Disorder. Occam’s Razor: Vol. 1 , Article 2. Retrieved from https://cedar.wwu.edu/orwwu/vol1/iss1/2.
Bleiweis, R. (2020, March 24). Quick facts about the gender wage gap. Center for American Progress. Retrieved from https://www.americanprogress.org/issues/women/reports/2020/03/24/482141/quick-facts-gender-wage-gap/.
Bureau, U. S. C. (2021, February 4). Poverty rate for people in female-householder families lowest on record. The United States Census Bureau. Retrieved from https://www.census.gov/library/stories/2019/09/poverty-rate-for-people-in-female-householder-families-lowest-on-record.html.
Cheryan, S. and V. C. Plaut. (2010). Explaining underrepresentation: A theory of precluded interest. Sex Roles, 63(7-8), 475-488. Retrieved from https://www.ncbi.nlm.nih.gov/pmc/articles/PMC2937137/.
Cimpian, J. (2018, April 23). How our education system undermines gender equity. Brookings Institution. Retrieved from https://www.brookings.edu/blog/brown-center-chalkboard/2018/04/23/how-our-education-system-undermines-gender-equity/.
Clifford, C. (2018, April 10). These 10 jobs have the largest and smallest pay gaps between men and women. CNBC. Retrieved from https://www.cnbc.com/2018/04/09/the-10-jobs-with-the-largest-and-smallest-gender-pay-gaps.html.
Conversion therapy. (2018, November 8). GLAAD. Retrieved from https://www.glaad.org/conversiontherapy.
Drescher, J. (2015, December 4). Out of DSM: Depathologizing homosexuality. Behavioral sciences (Basel, Switzerland). Retrieved from https://www.ncbi.nlm.nih.gov/pmc/articles/PMC4695779/.
Feldblum, C. R. and V. A. Lipnic. (2016). Select task force on the study of harassment in the workplace: Report of the co-chairs of the EEOC. Retrieved from the Equal Employment Opportunity Commission: https://www.eeoc.gov/eeoc/task_force/harassment/upload/report.pdf.
Fisher, D. A., D. L. Hill, J. W. Grube and E. L. Gruber. (2007). Gay, lesbian, and Bisexual content on television. Journal of Homosexuality, 52(3-4), 167–188. Retrieved from https://www.tandfonline.com/doi/abs/10.1300/J082v52n03_08.
Flaherty, C. (2020, June 15). Study says biological research still treats female subjects as an afterthought. Retrieved from https://www.insidehighered.com/news/2020/06/15/study-says-biological-research-still-treats-female-subjects-afterthought.
GLAAD’S Where We Are On TV 2020-2021 Report: Despite Tumultuous Year in Television, LGBTQ Representation Holds Steady. (2021, January 14). GLAAD. Retrieved from https://www.glaad.org/releases/glaads-where-we-are-tv-2020-2021-report-despite-tumultuous-year-television-lgbtq.
Hymowitz, C. (2009, May 1). For executive women, it can be lonely at the top. Forbes. Retrieved from http://www.forbes.com/2009/05/01/executives-c-suite-leadership-forbes-woman-power-careers.html.
International Rehabilitation Council for Torture Victims. (2021, September 2). Conversion therapy is torture. International Rehabilitation Council for Torture Victims. Retrieved from https://irct.org/media-and-resources/latest-news/article/1027.
Jones, A. (2021, March 20). Visualizing the unequal treatment of LGBTQ people in the criminal justice system. Prison Policy Initiative. Retrieved from https://www.prisonpolicy.org/blog/2021/03/02/lgbtq/.
Johnson Lewis, J. (2019, July 19). How does comparable worth work? ThoughtCo. Retrieved from https://www.thoughtco.com/comparable-worth-pay-equity-3529471.
Kearl, H., N. E. Johns and A. Raj. (2019). Measuring #metoo: A national study on sexual harassment and assault. Retrieved from Stop Street Harassment: http://www.stopstreetharassment.org/wp-content/uploads/2012/08/2019-MeToo-National-Sexual-Harassment-and-Assault-Report.pdf.
Kerber, R. (2021, February 17). Pay gap for U.S. female Executives narrows but persists. Reuters. Retrieved from https://www.reuters.com/article/us-usa-companies-compensation-women/pay-gap-for-u-s-female-executives-narrows-but-persists-idUSKBN2AH1J4.
Ma, A. (2020, October 26). The history of Decriminalizing homosexuality in the United States. Homoglobin. Retrieved from https://www.homoglobin.org/blog/the-history-of-decriminalizing-homosexuality-in-the-united-states.
Magnusson, C. (2009). Gender, occupational prestige, and wages: A test of devaluation theory. European Sociological Review, 25(1), 87–101.
Maranto, Robert, Kristen Carroll, Albert Cheng and Manuel P. Teodoro (2018, September 24). Boys will be superintendents: School leadership as a gendered profession. Phi Delta Kappan, 100 (2), 12-15. Retrieved from https://kappanonline.org/maranto-carroll-cheng-teodoro-school-leadership-gender/.
McInroy, L. B. and S. L. Craig. (2016). Perspectives of LGBTQ emerging adults on the depiction and impact of LGBTQ media representation. Journal of Youth Studies, 20(1), 32–46. https://www.tandfonline.com/doi/full/10.1080/13676261.2016.1184243.
Morgenroth, T., T. Kirby, M. Ryan and A. Sudkämper. (2020). The who, when, and why of the glass cliff phenomenon: A meta-analysis of appointments to precarious leadership positions. Psychological Bulletin. 146. 10.1037/bul0000234.
Nondiscrimination laws. Movement Advancement Project. (2021, September 16). Retrieved from https://www.lgbtmap.org/equality-maps/non_discrimination_laws.d.
Overview of Findings (2019). GLAAD. (2019, May 23). Retrieved from https://www.glaad.org/sri/2019/overview.
Perez, C. C. (2020). Invisible women. Random House UK.
Puente, M. and C. Kelly. (2018, February 23). The 94 percent: How common is sexual misconduct in Hollywood? USA Today. Retrieved from https://www.usatoday.com/story/life/people/2018/02/20/how-common-sexual-misconduct-hollywood/1083964001/.
Queer representation in film and television. MediaSmarts. (2014, September 15). Retrieved from https://mediasmarts.ca/digital-media-literacy/media-issues/diversity-media/queer-representation/queer-representation-film-television.
Raley, A. B. and J. L. Lucas. (2006). Stereotype or success? Journal of Homosexuality, 51(2), 19–38. https://www.tandfonline.com/doi/abs/10.1300/J082v51n02_02.
Reskin, B. and I. Padavic. (2002). Women and men at work (2nd ed.). Thousand Oaks, CA: Pine Forge Press.
Samulowitz, A., I. Gremyr, E. Eriksson and G. Hensing. (2018, February 25). “Brave men” and “Emotional Women”: A Theory-Guided literature review on gender bias in health care and Gendered norms towards patients with chronic pain. Pain Research and Management. Retrieved from https://www.hindawi.com/journals/prm/2018/6358624/#copyright.
Stone, P. and A. Kuperberg. (2005). Anti-discrimination vs. anti-poverty? A comparison of pay equity and living wage reforms. Journal of Women, Politics & Policy, 27(5), 23–39.
Sherrill, A. (2009). Women’s pay: Converging characteristics of men and women in the federal workforce help explain the narrowing pay gap. Washington, DC: United States Government Accountability Office.
Shah, J. R. and A. Tanzi. (2021, September 14). U.S. Poverty Rate Rose From 60-Year Low, Incomes Fell Amid Virus. Bloomberg.com. Retrieved from https://www.bloomberg.com/news/articles/2021-09-14/u-s-poverty-rate-rose-from-60-year-low-incomes-fell-amid-virus.
U.S. Bureau of Labor Statistics. (2019, December 1). Women in the labor force: A Databook : BLS Reports. U.S. Bureau of Labor Statistics. https://www.bls.gov/opub/reports/womens-databook/2019/home.htm.
U.S. Bureau of Labor Statistics Reports, Report 1094. (2021, September). Highlights of Women’s Earnings in 2020. Data retrieved from : https://www.bls.gov/opub/reports/womens-earnings/2020/pdf/home.pdf.
U.S. Bureau of Labor Statistics. (2022, January 20). Employed persons by detailed occupation, sex, race, and Hispanic or Latino ethnicity. U.S. Bureau of Labor Statistics. Retrieved from https://www.bls.gov/cps/cpsaat11.htm.
U.S. Equal Employment Opportunity Commission. (2001). Jury finds Outback Steakhouse guilty of sex discrimination and illegal retaliation. Retrieved from http://www.eeoc.gov/press/9-19-01.html.
World Health Organization. (n.d.). Gender and women’s mental health. World Health Organization. Retrieved from https://www.who.int/teams/mental-health-and-substance-use/gender-and-women-s-mental-health.
Women in the U.S. workforce. (2020, October 14). Catalyst. Retrieved from https://www.catalyst.org/research/women-in-the-workforce-united-states/.
Wolford, K. M. (2005). Gender discrimination in employment: Wage inequity for professional and doctoral degree holders in the United States and possible remedies. Journal of Education Finance, 31(1), 82–100. Retrieved from http://www.press.uillinois.edu/journals/jef.html.
Walsh, S. (2009). Dell settles sex discrimination suit for $9 million. Retrieved from http://www.gadgetell.com/ tech/comment/dell-settles-sex-discrimination-suit-for-9-million.
CC licensed content, Shared previously and Adapted
Barr, Scott, Sarah Hoiland, Shailaja Menon, Cathay Matresse, Florencia Silverira and Rebecca Vonderhaar. (n.d.). Introduction to Sociology. Introduction to Sociology | Simple Book Production. Lumen Learning. License: CC BY 4.0. License Terms: Access for free at https://courses.lumenlearning.com/wm-introductiontosociology/.
Conerly, Tonja, Kathleen Holmes, Asha Lal Tamang, Jennifer Hensley, Jennifer L. Trost, Pamela Alcasey, Kate McGonigal, Heather Griffiths, Nathan Keirns, Eric Strayer, Tommy Sadler, Susan Cody-Rydzewski, Gail Scaramuzzo, Sally Vyain, Jeff Bry and Faye Jones. (2021). Introduction to Sociology 3E. OpenStax. Houston, TX. License: CC BY 4.0. License Terms: Access for free at https://openstax.org/books/introduction-sociology-3e/pages/1-introduction.
Griffiths, Heather, Nathan Keirns, Eric Stayer, Susan Cody-Rydzewski, Gail Scaramuzzo, Tommy Sadler, Sally Vyain, Jeff Bry and Faye Jones. (2015). Introduction to Sociology 2E. OpenStax. Houston, TX. License: CC BY 4.0. License Terms: Access for free at https://openstax.org/books/introduction-sociology-2e/pages/1-introduction-to-sociology.
Saylor Foundation. (2015). Social Problems: Continuity and Change. License: CC BY-NC-SA 3.0. License Terms: Access for free at https://saylordotorg.github.io/text_social-problems-continuity-and-change/.
inequality based on gender that reults from cultural values and gender socialization which prioritize the male experience
inequality that results from heterosexuality being presented as the only normal or preferred orientation
when women are either underrepresented or overrepresented in a occupation in comparison to men
the idea that men and women should be compensated the same for work that has equivalent skill level and responsibilities
women may be promoted in a job only to find they reach an invisible barrier beyond which they cannot get promoted, or they may not get promoted in the first place
men rise through the ranks easily without many hoops to jump through
when a woman is hired by a company facing a crisis and is not supported and then held responsible for the company's troubles, which preceded her hiring
a phenomenon whereby women experience poverty at higher rates in comparison to men
unwelcome sexual advances, requests for sexual favors, or physical conduct of a sexual nature used as a condition of employment or promotion or that interferes with an individual’s job performance and creates an intimidating or hostile environment
a condition faced by women of color due to inequality associated with gender, race and social class, which more frequently places them near the bottom of the socioeconomic ladder
