The United States is generally regarded as a fairly religious nation. In a 2018 survey administered by the Gallup Organization, 71% of Americans answered yes when asked, “Is religion an important part of your daily life?” including 51% who said it was very important (Brennan, 2021). A Pew Research Center study found that 69% of Americans expressed a religious preference, with 63% identifying with a Christian religion, and 6% with non-Christian faiths, as shown in Figure 13.12 “U.S. Religious Affiliation, 2021” (Smith, 2021). The remaining 31% claimed no religious affiliation, agnosticism or atheism, or gave no response. These figures show that even though the degree of religiosity in the U.S. is in decline, that religion continues to play a significant role in the lives of many Americans.
Figure 13.12 U.S. Religious Affiliation, 2021
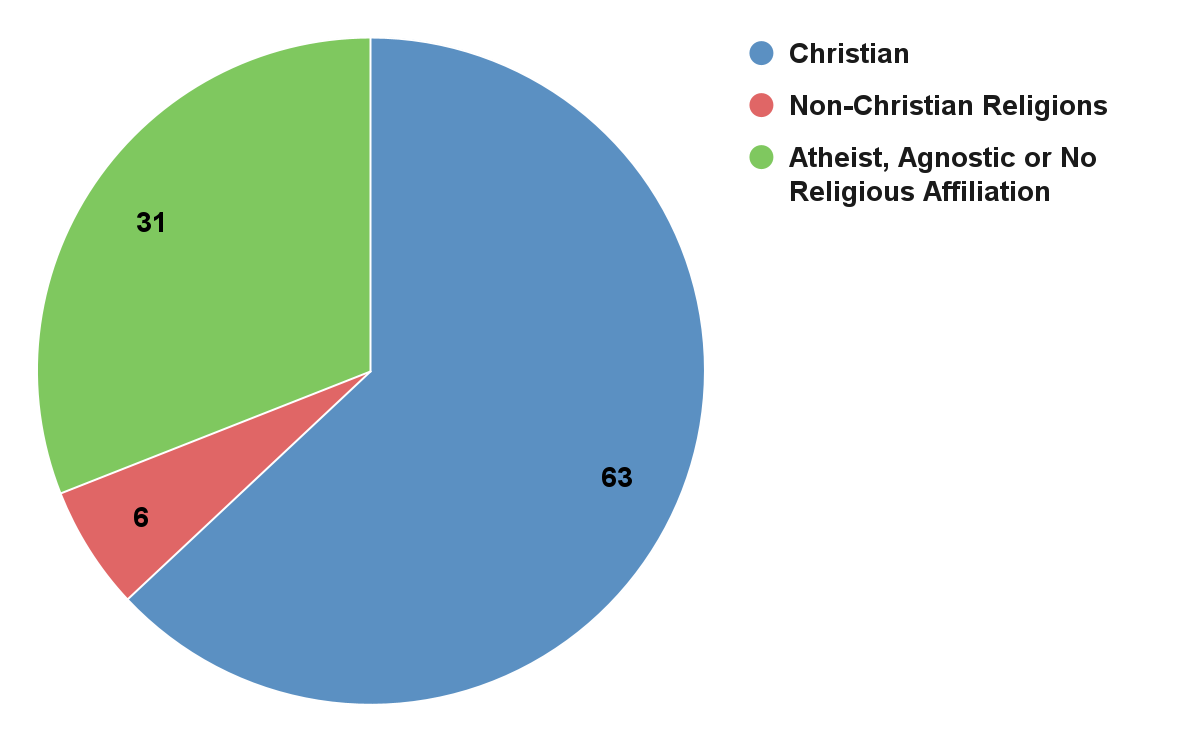
Source: Smith, Gregory A. About Three-in-Ten U.S. Adults Are Now Religiously Unaffiliated. December 14, 2021. Data retrieved from: https://www.pewforum.org/wp-content/uploads/sites/7/2021/12/PF_12.14.21_update_on_religion_trends_report.pdf.
Moreover, Americans seem more religious than the citizens of almost all the other democratic, post-industrial nations with which the United States is commonly compared. Evidence for this conclusion comes from the Pew Research Center survey, which found that slightly more than 41% of Americans believe religion to be very important in their lives (Smith, 2021). In contrast, a Pew survey of European countries found less than 21% of most adults were highly religious: Spain, 21%; France, 12%; Germany, 12%; United Kingdom, 11%; Sweden, 10%; (Evans, 2020). Among its peer nations, then, the United States stands out for being religious.
When we consider all the nations of the world, however, the U.S. ranking is much lower. In several Muslim-majority countries, such as Afghanistan, Indonesia and Pakistan, more than 90% say religion is very important in their lives (Pew, 2018). Other countries with high levels of religious adherence are found in Africa, south Asia and Latin America, such as Ethiopia, 98%; India, 80%; Nigeria, 88%; Uganda, 86%; Honduras, 90%; and Brazil, 72%. However, because the United States ranks higher than most of the democratic, post-industrial nations with which it is most aptly compared, it makes sense to regard the United States as fairly religious.
The data on religion discussed above reveals an interesting pattern that is relevant for understanding religious differences among the 50 states of the United States. Of the nations surveyed, people in the poorest nations were most likely to say that religion was an important part of their daily lives, and people in the richest nations were least likely to feel this way. The most religious nations with high percentages of their populations saying that religion was an important part of their daily lives, are low- and low-middle income nations. In contrast, among the least religious nations are some of the world’s wealthiest nations. A Gallup report concluded that these results demonstrate “the strong relationship between a country’s socioeconomic status and the religiosity of its residents” (Crabtree, 2010). Drawing on research by sociologists and other social scientists, the report explained that religion helps people in poorer nations cope with the many hardships that poverty creates.
Figure 13.13 Percentage of respondents in the USA stating that religion is “very important” or “somewhat important” to their lives
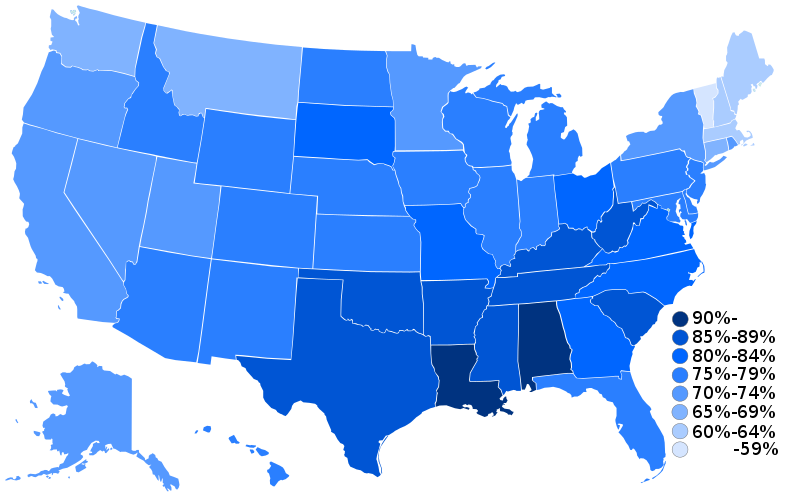
w:en:Some thing (talk | contribs), Zx-man (talk | contribs), Zntrip (talk | contribs) – CC BY-SA 3.0 – Wikimedia Commons
Similarly, researchers find the correlation between poverty and religiosity present in the United States. In the southern U.S. and Appalachian states, there is a high concentration of poverty, concurrently, surveys have found that these same states have the highest percentages of people proclaiming religion to be an important part of their daily lives, as shown in Figure 13.13 “Percentage of respondents in the USA stating that religion is “very important” or “somewhat important” to their lives.” There are many reasons for the high degree of religiosity in southern and Appalachian states, such as religious traditions, denominations, and racial and ethnic composition (Newport, 2009), however, it is notable that these states are also generally the poorest in the nation. If the poorest nations of the world are more religious in part because of their poverty, then the Southern and Appalachian states may also be more religious partly because of their poverty. In understanding religious differences among the different regions of the country, the United States has much to learn from the other nations of the world.
Religious Affiliation and Religious Identification
is a term that can mean actual membership in a church, synagogue, mosque or temple, or just a stated identification with a particular religion whether or not someone actually belongs to a local house of worship. Another term for religious affiliation is religious preference. Recall from the Pew study that 69% of Americans expressed a religious preference. The same survey also found only 31% regularly attend services weekly or monthly. As these figures indicate, more people identify with a religion than practice it in a formal setting.
The Pew Research Center also tracks data on religious identification (see Figure 13.14 “Religious Preference in the United States”). Nearly half (48.6%) of Americans say their religious preference is Protestant (including 1.6% who are Mormon), while about 21% consider themselves Catholic. Six percent of respondents claim a non-Christian faith, including: Jewish, 2%; Muslim, 1%; Buddhist, .7%; and Hindu, .7%.
Figure 13.14 Religious Preference in the United States
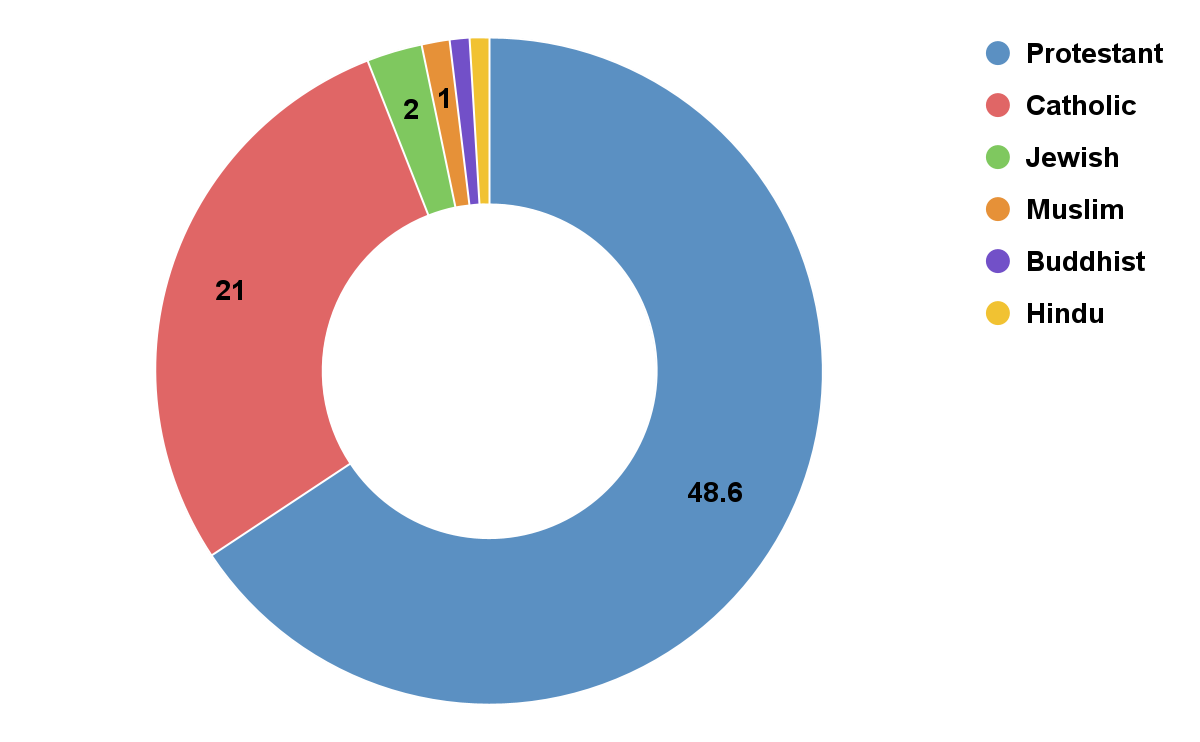
Source: Religion in America: U.S. religious data, Demographics and statistics. Pew Research Center’s Religion & Public Life Project. (2020, September 9). Retrieved December 15, 2021 from https://www.pewforum.org/religious-landscape-study/.
Although Protestants are half of those who claim a religious identity, their churches can be categorized by whether or not they are evangelical, mainline or historically Black. Of those who are Protestant, 25.4% are evangelical Protestants, who stress being “born again,” a literal interpretation of the Bible, that salvation only comes through belief in Jesus and the practice of proselytizing; 14.7% are mainline Protestants, who read the Bible more as a historical document, believe there is more than one means of salvation and are less prone to proselytize; and 6.5% are historically Black Protestants, which speaks to the degree of segregation that exists in religious life in the U.S. (Green). Interestingly, while only 50% of the U.S. population identify as Protestants, a full 79% of African Americans do so, with 53% of African American Protestants attending historically Black churches, 14% attending evangelical Protestant churches and just 4% attending mainline Protestant churches (Pew, 2020). In addition, Protestants can also be grouped by denomination, of which there are many, including groups such as Baptists, Methodists, Lutherans, Pentecostals, Presbyterians, Episcopalians and Adventists.
Correlates of Religious Affiliation
As discussed above, religious affiliation differs widely in the nature of their religious belief and practice, and by demographic variables of interest to sociologists (Finke & Stark, 2005). For example, evangelical and historically Black Protestants tend to live in the South and to have low levels of education and are working- and lower-class, while mainline Protestants tend to live in the North and Northeast and are wealthier and better educated than evangelical Protestants. In their education and incomes, the majority of Catholics are in the working- and lower-classes, with 46% having earned a high school degree or less. Jews are concentrated in a few states in the northeast, are predominantly white, well-educated and middle- and upper-class (Pew, 2018).

Race and ethnicity are related to religious affiliation. African Americans are overwhelmingly Protestant, for example, while Latinx Americans are primarily Catholic. Lukas Hartmann from Pexels
As indicated above, race and ethnicity are related to religious affiliation. African Americans are overwhelmingly Protestant, affiliating primarily with the Baptist denomination, while Latinos are most likely to be Catholic. Conversely, Asian Americans more often affiliate with the Hindu, Buddhist or Muslim faiths (See Figure 13.15 “Racial and Ethnic Composition by Religious Group”). White Americans are found in significant numbers among Catholic, Jewish, Mormon, Muslim, Buddhist and Protestant denominations.
Figure 13.15 Racial and Ethnic Composition by Religious Group
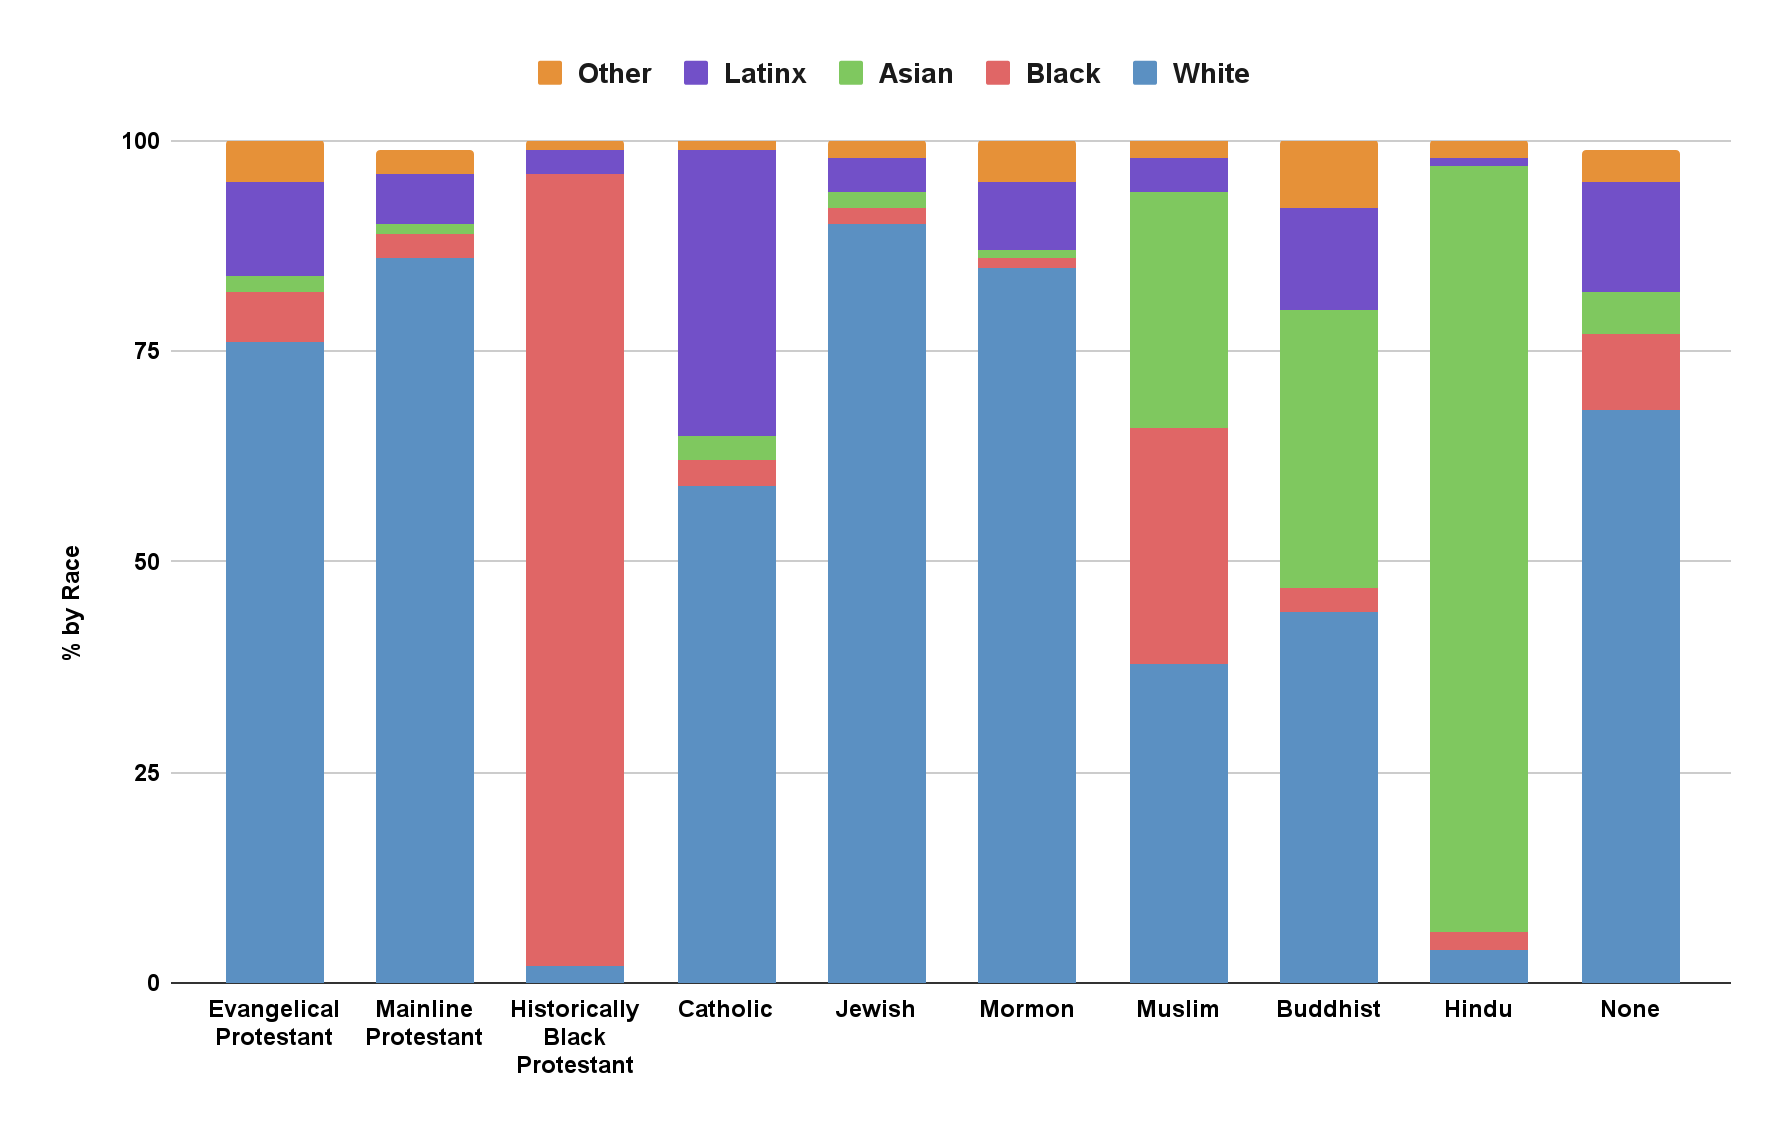
Source: Data from Pew Forum on Religion & Public Life. (2018). U.S. religious landscape survey. Washington, DC: Pew Research Center.
Age is yet another factor related to religious affiliation, as older people are more likely than younger people to belong to a church or synagogue. As young people marry and “put roots down,” their religious affiliation increases, partly because many wish to expose their children to a religious education. However, of those individuals who claim no religious affiliation, 72% are under the age of 50 (Pew, 2018). Religious groups also vary in their age distribution, with Muslims, Buddhists and Hindus having a higher proportion of their adherents under the age of 50 (81%, 64% and 90%, respectively), while 50% or more of Catholics and evangelical Protestants Jews and mainline Protestants are 50 years old or older.
.
|
Using Your Sociological Imagination |
|
As noted in this section, one of the major changes occurring within the U.S. religious institution is an increase in Americans who are religiously unaffiliated, agnostic or atheist. This change is correlated with a decline in the percentage who identify as Christian (a decline from 75% in 2011 to 63% by 2021). Similarly, in 2021, 33% of U.S. adults state that religion is not at all important in their lives, compared to 16% in 2007, and 53% seldom or never attend religious services (Smith, 2021). Using your sociological imagination, provide an explanation for this change. What do you think this trend means for the future of religion in the U.S.? |
.
Religiosity
The degree of , or the significance of religion in a person’s life, an important topic of investigation, also varies by different social factors. Religiosity is measured in surveys in questions asking about the belief in a god or gods, the importance of religion in one’s life, attendance at formal religious services and the frequency of prayer. People can belong to a church, synagogue, mosque or temple, or claim a religious preference, but that does not necessarily mean they are very religious.
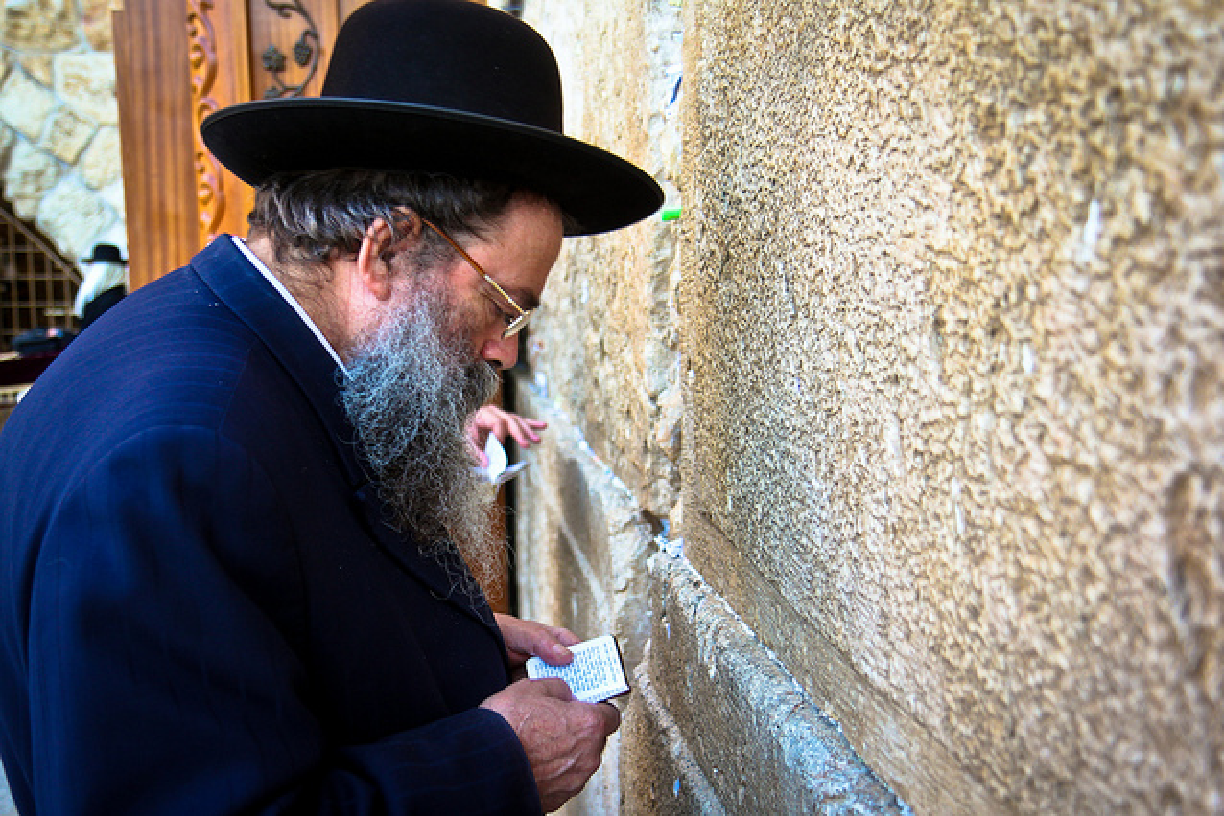
Older people are more likely than younger people to belong to a church or synagogue. Asim Bharwani – Reading at the Wall – CC BY-NC-ND 2.0
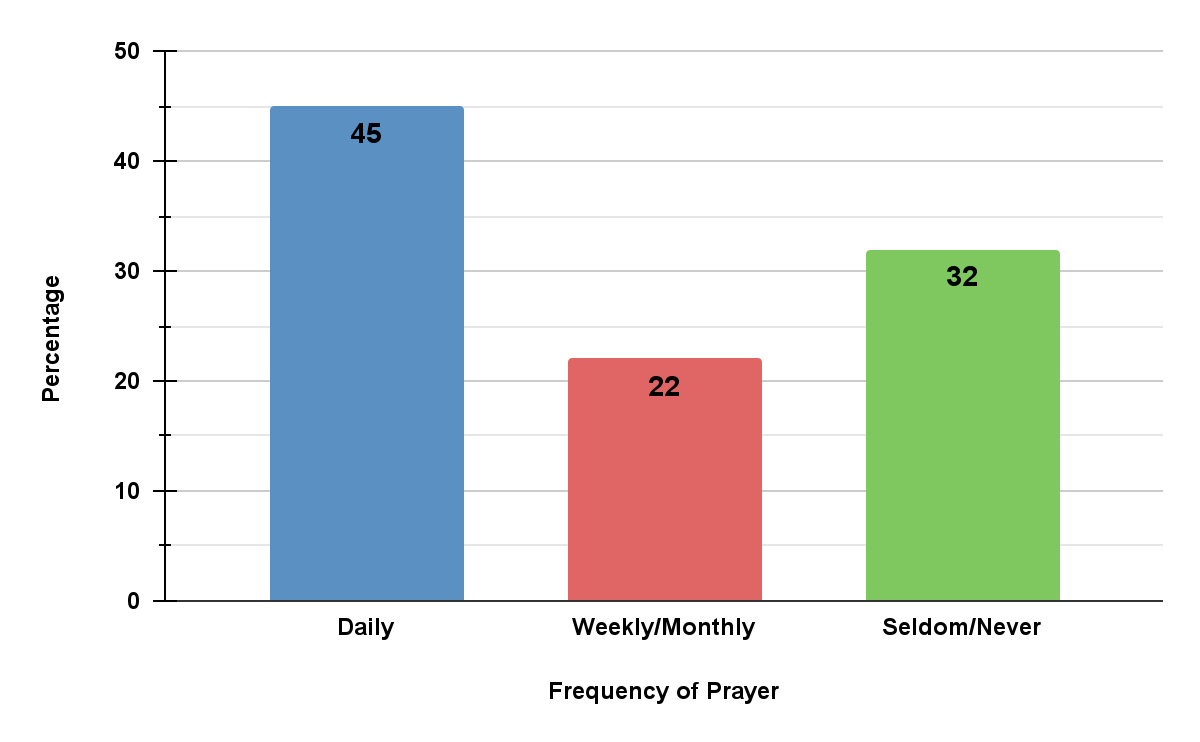
National data on prayer is perhaps especially telling when it comes to the level of religiosity (see Figure 13.16 “Frequency of Prayer”), as prayer occurs both with others and by oneself. Forty-five percent of Americans say they pray at least once daily, while 32% say they never pray, though these numbers include all Americans; among all evangelical Christians, for instance, 79% pray daily (Smith, 2021). Women are more likely than men to pray daily: 64% of women say they pray daily, versus only 46% of men (Pew, 2020). Daily prayer is also more common among older people than younger people, among African Americans than whites, and among people without a college degree than those with a college degree. As these demographic differences indicate, the social backgrounds of Americans affect this important dimension of their religiosity.
Figure 13.16 Frequency of Prayer
Source: Smith, G. (2021, December 14). About three-in-ten U.S. adults are now religiously unaffiliated. Pew Research Center’s Religion & Public Life Project. Retrieved December 15, 2021, from https://www.pewforum.org/2021/12/14/about-three-in-ten-u-s-adults-are-now-religiously-unaffiliated/?fbclid=IwAR3y8trHvXv0IZlzz5kmNzenTwkPnHDkfc44IQ-os4zhIN6k3E1M5IXLmKs.
In addition to gender and age, the degree of religiosity also varies by race-ethnicity. For instance, when asked about their belief in God, 83% of African Americans stated that they believe in God with absolute certainty, compared to 61% of White Americans, 44% of Asian Americans and 59% of Latinx Americans (Pew, 2018). Conversely, only 1% of African Americans do not believe in a god or gods, while 11% of White Americans, 19% of Asian Americans and 6% of Latinx Americans do not believe (Pew, 2018). Similarly, 75% of African American adults state that religion is very important in their lives, while 59% of Latinx Americans, 49% of White Americans and 36% of Asian Americans make this same claim (Pew, 2018). As you would expect, religious practice correlates with the above data, with African Americans having the highest rates of attendance at religious services, frequency of prayer and participation in religious education groups (Pew, 2018).
When we try to determine why some people are more religious than others, we are treating religiosity as a dependent variable. But religiosity itself can also be an independent variable, as it affects attitudes on a wide range of social, political, and moral issues. Generally speaking, the more religious people are, the more conservative their attitudes in these areas (Adamczyk & Pitt, 2009, Pew, 2020). For instance, when surveyed, 62% if adults in the U.S. state that homosexuality should be accepted, while 31% say it should be discouraged. When examining conservative religious groups, such as evangelical Protestants, Jehovah’s Witnesses and Mormons, data shows significantly less tolerance for sexual orientation diversity, with 55% of evangelical Protestants, 76% of Jehovah’s Witnesses and 57% of Mormons stating that homosexuality should be discouraged (Pew, 2018). This data aligns closely with religious belief and practice. Of those who believe homosexuality should be discouraged, 84% believe in God with absolute certainty, 78% say religion is a very important part of their daily lives, 59% attend religious services at least one time per week and 76% pray on a daily basis. Similar data is found when people are surveyed regarding attitudes about same-sex marriage, abortion rights and human evolution, in that people belonging to conservative religions tend to oppose same-sex marriage and the legal right to an abortion and believe in a creationist doctrine rather than in scientific findings related to human evolution (Pew, 2018).
.
|
Think Like a Sociologist |
|
Conduct a mental study of 5-6 people you know, using the different variables discussed above related to religious affiliation and religiosity. Do they match the data about religious affiliation based on their age, social class, race-ethnicity and region? If not, what do you think accounts for the difference? What other demographic factors might be considered? Concerning religiosity, how important is their faith? Do they pray, attend religious services, etc.? How much does their religion affect their views on social, political and moral topics? |
.
While religiosity can affect attitudes on various issues, it can also affect behavior and health. Researchers have found that involvement in religion, especially attendance at religious services, is positively associated with better physical and mental health, including lower rates of cardiovascular disease, hypertension (high blood pressure), and mortality (Ellison & Hummer, 2010; Green & Elliott, 2010). It is also linked to higher rates of happiness and lower rates of depression and anxiety.
These effects are thought to stem from several reasons. First, religious attendance increases social ties that provide emotional and practical support when someone has various problems and that also raises one’s self-esteem. Second, personal religious belief can provide comfort in times of trouble. Third, religious involvement promotes healthy lifestyles for at least some people, including lower use of tobacco, alcohol, and other drugs, and reduces the frequency of other risky behaviors such as gambling and unsafe sex. Lower participation in all of these activities helps in turn to increase one’s physical and mental health.
Test Yourself
Section 13.9 References
Adamczyk, A. and C. Pitt. (2009). Shaping attitudes about homosexuality: The role of religion and cultural context. Social Science Research, 38(2), 338–351.
Brenan, M. (2021, November 20). Religion considered important to 72% of Americans. Gallup.com. Retrieved from https://news.gallup.com/poll/245651/religion-considered-important-americans.aspx.
Crabtree, S. (2010). Religiosity highest in world’s poorest nations. Retrieved from http://www.gallup.com/poll/ 142727/religiosity-highest-world-poorest-nations.aspx.
Ellison, C. G. and R. A. Hummer, (Eds.). (2010). Religion, families, and health: Population-based research in the United States. New Brunswick, NJ: Rutgers University Press.
Evans, J. and C. Baronavski. (2020, May 31). How do European countries differ in religious commitment? Use our interactive map to find out. Pew Research Center. Retrieved from https://www.pewresearch.org/fact-tank/2018/12/05/how-do-european-countries-differ-in-religious-commitment/.
Finke, R., & Stark, R. (2005). The churching of America: Winners and losers in our religious economy (2nd ed.). New Brunswick, NJ: Rutgers University Press.
Newport, F. (2009). State of the states: Importance of religion. Gallup. Retrieved from http://www.gallup.com/poll/114022/state-states-importance-religion.aspx.
Pew Forum on Religion & Public Life. (2008). U.S. religious landscape survey. Washington, DC: Pew Research Center.
Pew Research Center. (2020, August 28). Political typology: Views on religion and Social Issues. Pew Research Center – U.S. Politics & Policy. Retrieved from https://www.pewresearch.org/politics/2017/10/24/9-views-on-religion-and-social-issues/.
Religion in America: U.S. religious data, Demographics and statistics. (2020, September 9). Pew Research Center’s Religion & Public Life Project. Retrieved from https://www.pewforum.org/religious-landscape-study/.
Smith, G. (2021, December 14). About three-in-ten U.S. adults are now religiously unaffiliated. Pew Research Center’s Religion & Public Life Project. Retrieved from https://www.pewforum.org/2021/12/14/about-three-in-ten-u-s-adults-are-now-religiously-unaffiliated/?fbclid=IwAR3y8trHvXv0IZlzz5kmNzenTwkPnHDkfc44IQ-os4zhIN6k3E1M5IXLmKs.
CC licensed content, Shared previously and Adapted
Barr, Scott, Sarah Hoiland, Shailaja Menon, Cathay Matresse, Florencia Silverira and Rebecca Vonderhaar. (n.d.). Introduction to Sociology. Introduction to Sociology | Simple Book Production. Lumen Learning. License: CC BY 4.0. License Terms: Access for free at https://courses.lumenlearning.com/wm-introductiontosociology/.
Conerly, Tonja, Kathleen Holmes, Asha Lal Tamang, Jennifer Hensley, Jennifer L. Trost, Pamela Alcasey, Kate McGonigal, Heather Griffiths, Nathan Keirns, Eric Strayer, Tommy Sadler, Susan Cody-Rydzewski, Gail Scaramuzzo, Sally Vyain, Jeff Bry and Faye Jones. (2021). Introduction to Sociology 3E. OpenStax. Houston, TX. License: CC BY 4.0. License Terms: Access for free at https://openstax.org/books/introduction-sociology-3e/pages/1-introduction.
Griffiths, Heather, Nathan Keirns, Eric Stayer, Susan Cody-Rydzewski, Gail Scaramuzzo, Tommy Sadler, Sally Vyain, Jeff Bry and Faye Jones. (2015). Introduction to Sociology 2E. OpenStax. Houston, TX. License: CC BY 4.0. License Terms: Access for free at https://openstax.org/books/introduction-sociology-2e/pages/1-introduction-to-sociology.
Saylor Foundation. (2015). Social Problems: Continuity and Change. License: CC BY-NC-SA 3.0. License Terms: Access for free at https://saylordotorg.github.io/text_social-problems-continuity-and-change/.
a term that can mean actual membership in a church or synagogue, or just a stated identification with a particular religion whether or not someone actually belongs to a local house of worship
how often people practice rituals associated with religion (e.g., pray, go to service, etc.)
