Education in the United States is a massive social institution involving millions of people and billions of dollars. In 2021, over 73.4 million people, almost one-fourth of the U.S. population, attended school at all levels. This includes 48.1 million children who were enrolled in K-12 public schools, about 5.7 million who attended private schools, and 19.6 million students attending college or university. They attend some 133,000 elementary and secondary schools, with $667 billion worth of funding for the 2018-2019 school year (National Center for Education Statistics, 2021).
Correlates of Matriculation and Educational Attainment
About 66% of U.S. high school graduates enroll in college the following fall, which is also called . This is a very high figure by international standards, as college in many other industrial and post-industrial nations is reserved for the very small percentage of the population who pass rigorous entrance exams, whereas higher education in the United States is open to all who graduate high school. However, a significant portion of these students do not complete their studies, as the overall dropout rate for undergraduate college students is 40% (Hanson, 2021). Nearly one-third of college freshmen drop out before their sophomore year and 56% of students drop out within six years. African American students have the highest dropout rate at 54%, and the most common reason cited for dropping out was financial pressure (Hanson, 2021).
.
|
Using Your Sociological Imagination |
|
Geralt – Pixabay One of the major reasons why students leave college before graduation has to do with financial instability. Students may lack the funds some semesters to pay for tuition and housing. Some students work part- or full-time to support themselves and sometimes their families, making it difficult to achieve a balance between the demands of work and school. In addition to financial struggles, there are many other obstacles that students face. Brainstorm for a few minutes to come up with 3-5 more reasons (other than financial problems) that cause students to drop out of college. Choose one reason from your list and devise a solution that colleges could adopt to help students stay in school. Check out this website: Leaving Academia. Are the explanations you came up with on this list? |

.
Our chances of completing high school, attending college and completing a college degree are greatly determined at birth, as social class and race-ethnicity have a significant effect on access to and completion of college. For instance, Figure 13.1 “Race, Ethnicity, and High School Dropout Rate, 16–24-Year-Olds, 1990-2019” shows how race and ethnicity affect high school dropout rates. The dropout rate is highest for Latinx Americans and lowest for white Americans. However, note the decline in dropout rates over time for all groups, especially Latinx students, whose dropout rate in 2019 was roughly 3/8 of the rate it was in 2007.
Figure 13.1 Race, Ethnicity, and High School Dropout Rate, 16–24-Year-Olds, 2007-2019

*AI/AN represents American Indians and Alaskan Natives
Source: National Center for Education Statistics. Digest of Education Statistics. Table 219.80. Retrieved from https://nces.ed.gov/programs/digest/d20/tables/dt20_219.80.asp?current=yes.
Similarly, one way of illustrating how income and race-ethnicity affect the chances of achieving a college degree is to examine the percentage of high school graduates who enroll in college following graduation and who ultimately complete a college degree.
As Figure 13.2 “Family Income and Percentage of High School Graduates Who Attend, Persist and Complete College” shows, students graduating from high-income schools in 2020 are more likely than those graduating the same year from low-income schools to attend college immediately following high school graduation. It is important to note, however, that the gap in college enrollment rates between high- and low-income students has narrowed in recent decades, from a gap of 30 percentage points in 2000 to only 16 percentage points in 2020 (The Condition of Education, 2018; National Student Clearinghouse Research Center, 2021). A common educational benchmark are persistence rates, or, in this case, the rates at which students enroll in consecutive years once they have entered college. As you can also see in Figure 13.2, the first to second year persistence rates for 2018 graduates, from high-income schools, were nine percentage points higher than those of their counterparts from low-income schools. Another important educational benchmark is the percent of students who graduate from college within 6 years of their high school graduation. By now, it should come as no surprise that Figure 13.2 reports a significant gap, twenty-two percentage points, between 2014 graduates from low- and high-income schools.
Figure 13.2 Family Income and Percentage of High School Graduates Who Attend, Persist and Complete College

* High income schools = those with less than 50% qualifying for free/reduced lunch
**Low income schools = those with more than 50% qualifying for free/reduced lunch
Source: High School Benchmarks: National College Progression Rates, December 1, 2021. National Student Clearinghouse Research Center. Data retrieved from https://nscresearchcenter.org/wp-content/uploads/2021_HSBenchmarksReport.pdf.
For race-ethnicity, it is useful to examine the percentage of 18- to 24-year-olds enrolled in college in order to compare across groups. As shown below in Figure 13.3 “Enrollment Rates of 18- to 24-year-olds in college, by race-ethnicity, 2000, 2010 and 2020,” there is variation in college attendance within the traditionally aged college population by race-ethnicity. With fifty-nine percent of 18- to 24-year-olds enrolled in college, Asian Americans by far have the highest rate of college attendance. In comparison, American Indians, Alaskan Natives and Pacific Islanders have the lowest rates of college enrollment, at 24%. Each racial-ethnic group experiences fluctuation in college enrollment over time, however, one group that has shown consistent increases in enrollment rates from 2000 to 2020 are Latinx Americans, who have increased enrollment from 22% to 36% (The Condition of Education 2021).
Figure 13.3 Enrollment Rates of 18- to 24-year-olds in college, by race-ethnicity, 2000, 2010 and 2020
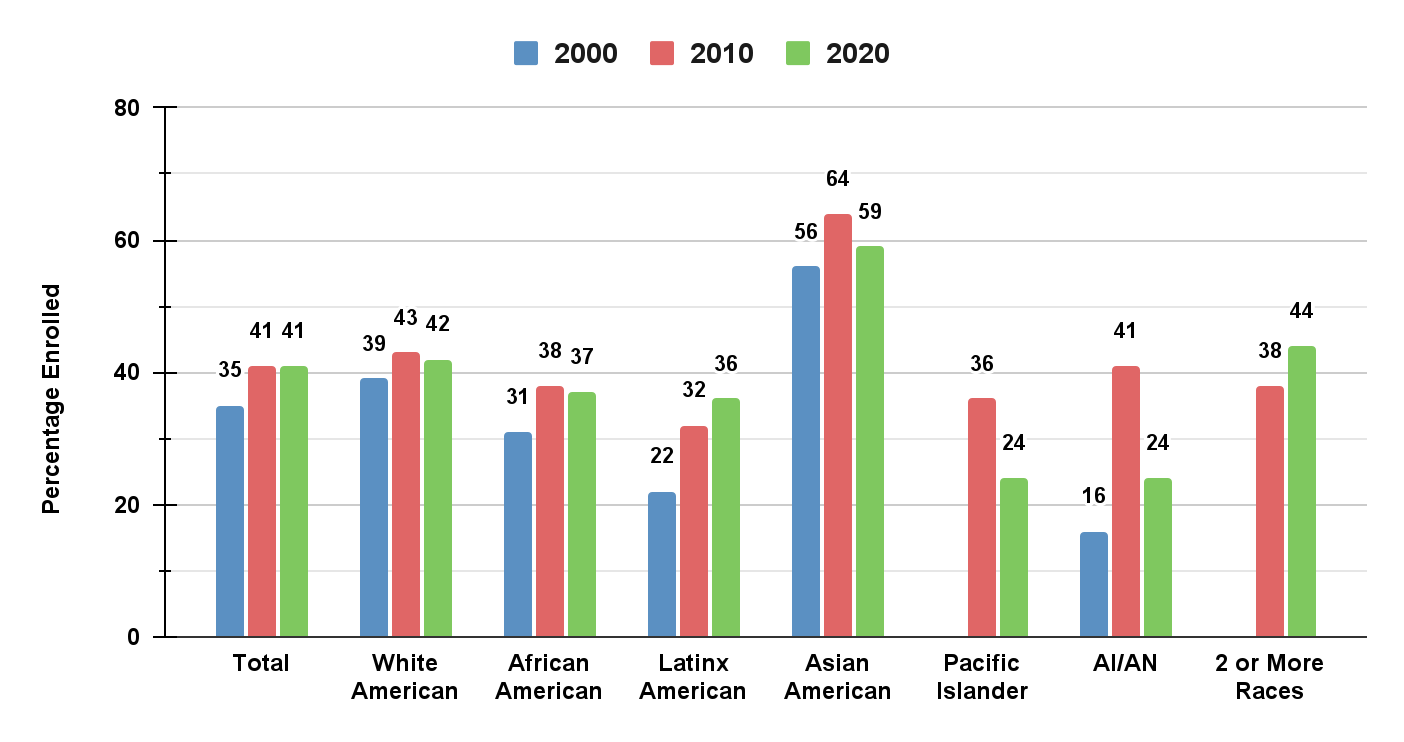
*AI/AN represents American Indian and Alaska Natives.
Source: Data from Irwin, V., NCES; Zhang, J., X. Wang, S. Hein, K. Wang, A. Roberts, C. York, AIR; A. Barmer, F. Bullock Mann, R. Dilig and S. Parker, RTI. (2021, May 25). Condition of education 2021. National Center for Education Statistics (NCES) Home Page, a part of the U.S. Department of Education. Data retrieved from https://nces.ed.gov/pubsearch/pubsinfo.asp?pubid=2021144.
Data on retention of students once enrolled in college show that currently about 60% of students who begin seeking a bachelor’s degree complete that degree within 6 years (The Condition of Education, 2021). Additionally, rates of degree attainment vary by race-ethnicity, as shown below in Figure 13.4 ”Race-Ethnicity and Percentage of Persons 25 or Older with a Bachelor’s or Higher Degree, 2017 and 2020.” As demonstrated, Asian Americans have the highest rate of degree attainment, while American Indian/Alaska Natives, Latinx and African Americans are least likely to have a degree.
Figure 13.4 Race-Ethnicity, and Percentage of Persons 25 or Older with a Bachelor’s or Higher Degree, 2017 and 2020
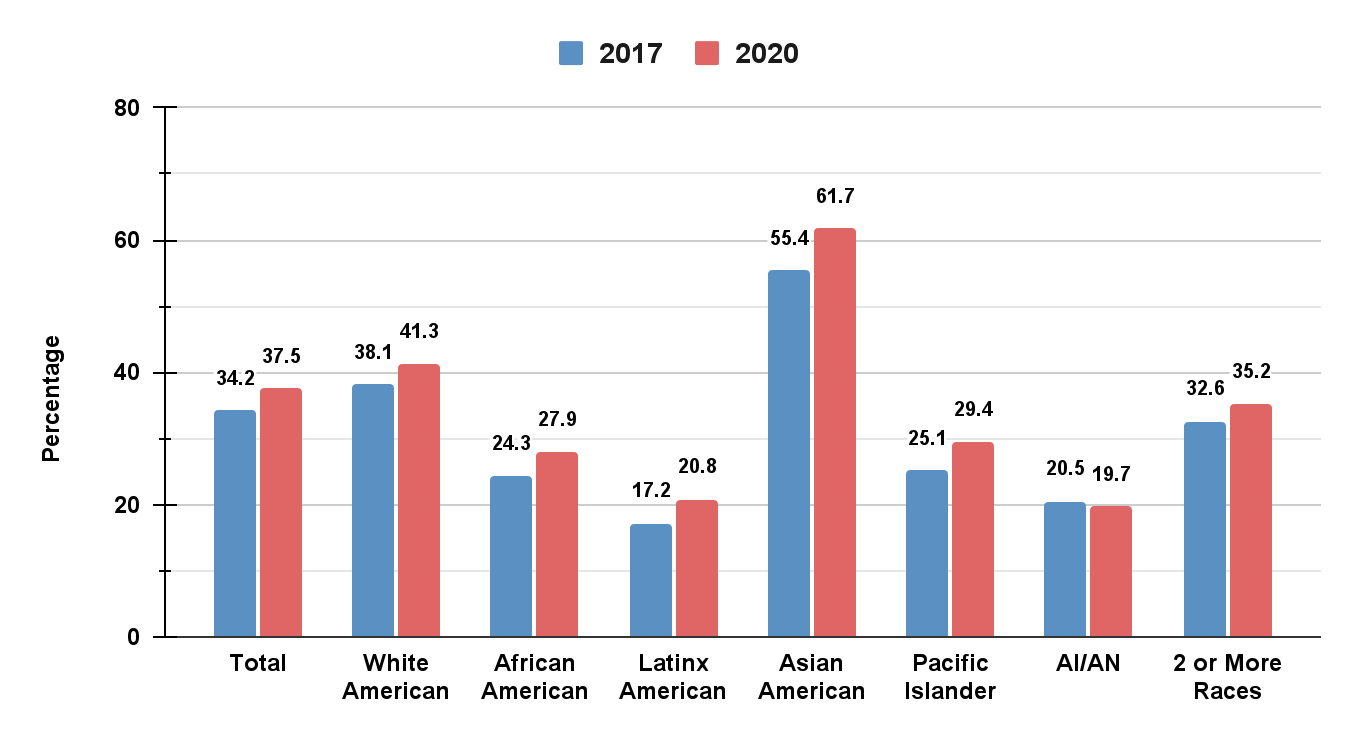
*AI/AN represents American Indian and Alaska Natives.
Source: NCES-U.S. Department of Education, National Center for Education Statistics (2021). https://nces.ed.gov/programs/digest/d20/tables/dt20_104.10.asp.
Why do American Indian, Alaska Natives, Latinx and African Americans have lower educational attainment? Two factors are commonly cited: (a) the underfunded and otherwise inadequate schools that children in these groups often attend and (b) the higher poverty of their families and lower education of their parents that often leave them ill-prepared for school even before they enter kindergarten (Ballantine & Hammack, 2009; Yeung & Pfeiffer, 2009).
.
|
Think Like a Sociologist |
|
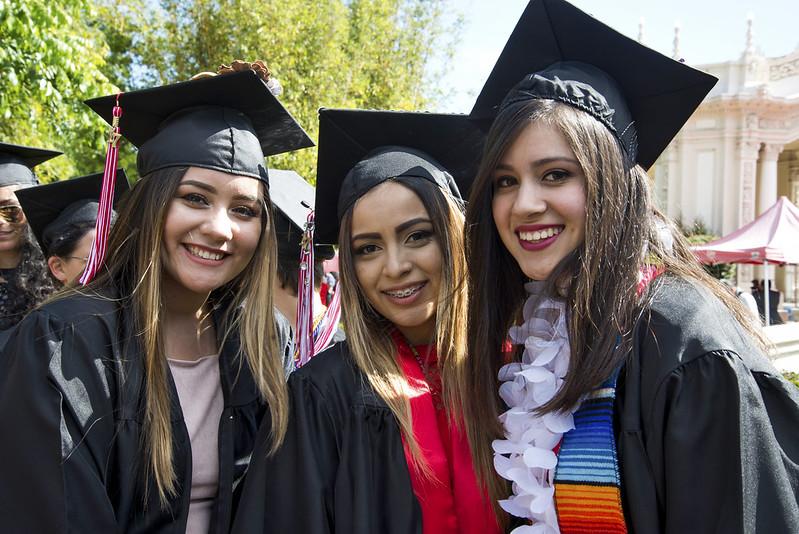
San Diego City College – CC BY-NC-ND 2.0 – Flickr Does gender affect educational attainment? The answer is, of course, it does. But perhaps not in the way you expect. In 2020, slightly more women than men hold a bachelor’s degree or higher: 38.3% of women and 36.7% of men (Irwin, et. al., 2021). While women were less likely than men in earlier generations to go to college, the reverse is now true. In the 2020-21 academic year, 59.5% of undergraduates are women (National Student Research Center 2020). Consider this: In 1960, only about 35% of all bachelor’s degrees were earned by women, but by 2020, 57.3% of all bachelor’s degrees were earned by women (Irwin, et. al., 2021). During the same period, women have also made great strides in joining the labor force. In 1950, 27.4% of the labor force were women, which jumped up slightly to 32.2% by 1960. By 2020, women comprised 47% of the labor force and it is estimated that they will make up 51.5% of the labor force by 2029 (U.S. Department of Labor, Women’s Bureau, n.d.). Of course, women making gains in education and employment is incredibly great news. Some people view these types of situations through the lens of a – or where one group’s gain necessarily means another group’s loss. People who use this type of lens assume that there is a finite amount of whatever resource is in question. In this case, some people have argued that whatever gains women make come at the expense of men. What do you think? Could you come up with a different argument using a functionalist perspective? |
.
The Difference Education Makes: Income
Have you ever applied for a job that required a high school degree? Are you going to college in part because you realize you will need a college degree for a higher-paying job? As these questions imply, the United States is a (Collins, 1979). This means at least two things. First, a high school or college degree (or beyond) indicates that a person has acquired the needed knowledge and skills for various jobs. Second, a degree at some level is a requirement for most jobs. As you know full well, a college degree today is a virtual requirement for a job that pays a livable wage. Over the years the ante has been upped considerably, as in earlier generations a high school degree, if even that, was all that was needed, if only because so few people graduated from high school to begin with (see Figure 13.5 “Percentage of Population 25 or Older With at Least a High School Degree, 1910–2020”). With so many people graduating from high school today, a high school degree is not worth as much. Then, too, today’s technological and knowledge-based postindustrial society increasingly requires skills and knowledge that only a college education brings.
Figure 13.5 Percentage of Population 25 or Older With at Least a High School Degree, 1910–2020

Source: Irwin, V., NCES; Zhang, J., X. Wang, S. Hein, K. Wang, A. Roberts, C. York, AIR; A. Barmer, F. Bullock Mann, R. Dilig and S. Parker, RTI. (2021, May 25). Report on the Condition of education 2021. National Center for Education Statistics (NCES) Home Page, a part of the U.S. Department of Education. Retrieved from https://nces.ed.gov/pubsearch/pubsinfo.asp?pubid=2021144.
A credential society also means that people with more educational attainment have higher rates of employment and achieve higher incomes. For instance, in 2019, for people aged 25 – 64 years old, only 61.2% of those with less than a high school degree were participating in the labor force, while those with a high school diploma had a participation rate in the labor force of 72.7%. Comparing these data to those who had some college but did not attain a bachelor’s degree and those with a bachelor’s degree or higher, whose rates of participation were 78.4% and 87.3%, respectively, it is clear that educational attainment plays a crucial role in job opportunity (Digest of Education Statistics, 2020).
Similarly, annual earnings are indeed much higher for people with more education (see Figure 13.6 “Median Annual Earnings of Persons 25 to 34 Years by Level of Educational Attainment, 2019”). As earlier chapters indicated, gender and race/ethnicity affect the payoff we get from our education, but education itself still makes a huge difference for our incomes.
Figure 13.6 Median Annual Earnings of Persons 25 to 34 years Old by Level of Educational Attainment, 2019 (Amounts in constant 2019 dollars)
 Source: Data from “Digest of Education Statistics, 2020.” National Center for Education Statistics (NCES) Home Page, a Part of the U.S. Department of Education, National Center for Education Statistics, https://nces.ed.gov/programs/digest/d20/tables/dt20_502.30.asp
The Difference Education Makes: Attitudes
Education also makes a difference for our attitudes. Researchers use different strategies to determine this effect. They compare adults with different levels of education; they compare college seniors with first-year college students; and sometimes they even study a group of students when they begin college and again when they are about to graduate. However they do so, they typically find that education leads us to be more tolerant and even approving of nontraditional beliefs and behaviors and less likely to hold various kinds of prejudices (McClelland & Linnander, 2006; Moore & Ovadia, 2006). Racial prejudice and sexism, two types of belief explored in previous chapters, all reduce with education. Education has these effects because the material we learn in classes and the experiences we undergo with greater schooling all teach us new things and challenge traditional ways of thinking and acting.
.
|
Using Your Sociological Imagination |
|
ParentRap – Pixabay (modified) Recall that in Chapter 1, we were introduced to Peter Berger’s important contributions to our understanding of how sociology helps us to interpret our social world from multiple perspectives. As Peter L. Berger (1963, pp. 23–24) noted in his classic book Invitation to Sociology, “the first wisdom of sociology is this—things are not what they seem.” Social reality, he said, has “many layers of meaning,” and a goal of sociology is to help us discover these multiple meanings. He continued, “people who like to avoid shocking discoveries… should stay away from sociology (Ramirez, et. al., 2022). Berger proceeds to describe the sociological perspective as a consciousness, or a way we perceive and make meaning out of what’s around us. Many people falsely believe sociology is “just using common sense” because what’s around us is the mundane, or the things/people/behaviors/places/ideas we see and interact with on a daily basis; the familiar. Seriously, who needs a degree in sociology in order to understand those things we interact with so often that we don’t even have to think about them anymore? Seems like an excellent question, right? But that was exactly Berger’s point. He helped us to understand that when something becomes a part of common sense, we seldom ever think about it anymore, so our understanding is limited, or even, as Einstein pointed out, based on our prejudices. So, as noted above, Berger tells us that sociology’s most important lesson is “things are not what they seem.” If we start with that type of skepticism, the sociological perspective provides us with themes, or what Berger called motifs, that organize our inquiry in such a way that helps us find multiple meanings in the familiar. Recall from chapter 1: …Berger was emphasizing, sociology helps us see through conventional understandings of how society works. He referred to this theme of sociology as the . By “looking for levels of reality other than those given in the official interpretations of society” (p. 38), Berger said, sociology looks beyond the on-the-surface understanding of social reality and helps us recognize the value of alternative understandings. In this manner, sociology often challenges conventional understandings about social reality and social institutions (Ramirez, et. al., 2022). Berger went on to provide three additional motifs: unrespectability, relativizing and cosmopolitan. Each additional motif further typifies a dimension of the sociological perspective that encourages asking questions that reveal layers of meaning blurred by common sense. For example, the cosmopolitan motif involves “an openness to the world, to other ways of thinking and acting” (1963, pp. 51–52). In the end, he says, “the sociological perspective is a broad, open, emancipated vista on human life” (pp. 52). What do you think? How has your college education thus far challenged you to think beyond common sense? Give an example and explain. |

.
Test Yourself
Section 13.3 References
Ballantine, J. H. and F. M. Hammack. (2009). The sociology of education: A systematic analysis (6th ed.). Upper Saddle River, NJ: Prentice Hall.
Berger, P. L. (1963). Invitation to sociology: A humanistic perspective. Garden City, NY: Anchor Books.
Collins, R. (1979). The credential society: An historical sociology of education and stratification. New York, NY: Academic Press.
The Condition of Education 2018. (23 May 2018). National Center for Education Statistics (NCES) Home Page, a Part of the U.S. Department of Education, National Center for Education Statistics. Retrieved from https://nces.ed.gov/pubsearch/pubsinfo.asp?pubid=2018144.
Digest of Education Statistics. (2020). National Center for Education Statistics (NCES) Home Page, a Part of the U.S. Department of Education, National Center for Education Statistics. Retrieved from https://nces.ed.gov/programs/digest/2020menu_tables.asp.
Hanson, Melanie. (2021, November 22). College Dropout Rates. Education Data Initiative. Retrieved from https://educationdata.org/college-dropout-rates.
Irwin, V., NCES; Zhang, J., X. Wang, S. Hein, K. Wang, A. Roberts, C. York, AIR; A. Barmer, F. Bullock Mann, R. Dilig and S. Parker, RTI. (2021, May 25). Report on the Condition of education 2021. National Center for Education Statistics (NCES) Home Page, a part of the U.S. Department of Education. Retrieved from https://nces.ed.gov/pubsearch/pubsinfo.asp?pubid=2021144.
McClelland, K. and E. Linnander. (2006). The role of contact and information in racial attitude change among white college students. Sociological Inquiry, 76(1), 81–115.
Moore, L. M. and S. Ovadia. (2006). Accounting for spatial variation in tolerance: The effects of education and religion. Social Forces, 84(4), 2205–2222.
National Student Research Center. (2020). Overview: Fall 2020 Enrollment Estimates. Retrieved from https://nscresearchcenter.org/current-term-enrollment-estimates/.
The NCES Fast Facts Tool Provides Quick Answers to Many Education Questions (National Center for Education Statistics). (2021.) National Center for Education Statistics (NCES) Home Page, a Part of the U.S. Department of Education, National Center for Education Statistics. Retrieved from https://nces.ed.gov/fastfacts/display.asp?id=372.
Ramirez, J. M., S. Latham, R. G. Hernandez and A. E. Juskewycz. (2022). Exploring Our Social World : The Story of Us, Integrated Workbook Edition. License: CC BY-NC-SA 4.0 International License. Access for free at https://pb.openlcc.net/socl120oerworkbook/.
Top reasons to leave college. (2012, November 6). Leaving Academia. Retrieved from https://www.leavingacademia.com/top-reasons-to-leave/.
U.S. Department of Labor, Women’s Bureau. (n.d.). 100 Years of Working Women. Retrieved from https://www.dol.gov/agencies/wb/data/occupations-decades-100.
Yeung, W.-J. J. and K. M. Pfeiffer. (2009). The black-white test score gap and early home environment. Social Science Research, 38(2), 412–437.
CC licensed content, Shared previously and Adapted
Barr, Scott, Sarah Hoiland, Shailaja Menon, Cathay Matresse, Florencia Silverira and Rebecca Vonderhaar. (n.d.). Introduction to Sociology. Introduction to Sociology | Simple Book Production. Lumen Learning. License: CC BY 4.0. License Terms: Access for free at https://courses.lumenlearning.com/wm-introductiontosociology/.
Conerly, Tonja, Kathleen Holmes, Asha Lal Tamang, Jennifer Hensley, Jennifer L. Trost, Pamela Alcasey, Kate McGonigal, Heather Griffiths, Nathan Keirns, Eric Strayer, Tommy Sadler, Susan Cody-Rydzewski, Gail Scaramuzzo, Sally Vyain, Jeff Bry and Faye Jones. (2021). Introduction to Sociology 3E. OpenStax. Houston, TX. License: CC BY 4.0. License Terms: Access for free at https://openstax.org/books/introduction-sociology-3e/pages/1-introduction.
Griffiths, Heather, Nathan Keirns, Eric Stayer, Susan Cody-Rydzewski, Gail Scaramuzzo, Tommy Sadler, Sally Vyain, Jeff Bry and Faye Jones. (2015). Introduction to Sociology 2E. OpenStax. Houston, TX. License: CC BY 4.0. License Terms: Access for free at https://openstax.org/books/introduction-sociology-2e/pages/1-introduction-to-sociology.
Saylor Foundation. (2015). Social Problems: Continuity and Change. License: CC BY-NC-SA 3.0. License Terms: Access for free at https://saylordotorg.github.io/text_social-problems-continuity-and-change/.
enrolling in a college or university
a situation where one group’s gain necessarily means another group’s loss
a society in which eligibility for work is dependent upon the attainment of a degree or diploma
looking beyond the on-the-surface understandings of social reality and recognizing the value of alternative sociological understandings
