We now turn our attention from theoretical explanations of deviance and crime to certain aspects of crime and the people who commit it. What do we know about crime and criminals in the United States?
Crime and Public Opinion
One thing we know is that the American public is very concerned about . In a 2009 Gallup Poll, about 55% said crime is an “extremely” or “very” serious problem in the United States, and in other national surveys, about one-third of Americans said they would be afraid to walk alone in their neighborhoods at night (Maguire & Pastore, 2009; Saad, 2008).
Recall that according to the sociological perspective, our social backgrounds affect our attitudes, behavior, and life chances. Do gender and race affect our fear of crime? Figure 6.1 “Gender, Race and Fear of Crime” shows that both gender and race have quite a large effect. About 53% of women are afraid to walk alone at night, compared to only 22% of men. Because women are less likely than men to be victims of crime other than rape, their higher fear of crime reflects their heightened fear of rape and other types of sexual assault (Warr, 2000). Similarly, race also makes a difference, as shown below. Figure 6.1 “Gender, Race and Fear of Crime” shows that African Americans are more afraid than whites of walking near their homes alone at night. This difference reflects the fact that African Americans are more likely than whites to live in large cities with higher rates of crime (Peterson & Krivo, 2009).
Figure 6.1 Gender, Race and Fear of Crime

Source: Data from General Social Survey, 2016.
Race also affects views about the criminal justice system. For example, African Americans are much less likely than whites to favor the death penalty, in part because they perceive that the death penalty and criminal justice system in general are racially discriminatory (Johnson, 2008).
The Measurement of Crime
It is surprisingly difficult to know how much crime occurs. Usually when crime occurs, only the criminal and the victim, and sometimes an occasional witness, know about it. Although we have an incomplete picture of the crime problem, because of various data sources we still have a fairly good understanding of how much crime exists.
The government’s primary source of crime data is the Uniform Crime Report (UCR), published annually by the Federal Bureau of Investigation. The FBI gathers its data from police departments around the country. Most UCR data concerns Part I Offenses, which are the eight felonies that the FBI considers the most serious. Four of these are violent crimes: homicide, rape, aggravated assault, and robbery; four are property crimes: burglary, larceny (e.g., shoplifting, pickpocketing, purse snatching), motor vehicle theft and arson.
According to the FBI, in 2016 almost 1.25 million violent crimes occurred in the U.S., which is the equivalent to 386.3 violent crimes per every 100,000 people. In addition, there were 7.9 million property crimes in 2017, or 2450 property crimes for every 100,000 Americans. This is the nation’s official crime rate, and by any standard it is a lot of crime. Many people in the U.S. perceive that the rate of crime is growing, however, looking at longitudinal data from the FBI shows that the rate of crime is dropping over time, with some annual fluctuation. Table 6.3: “U.S. Crime Rates Over Time” demonstrates this trend. Note that while the population has increased by over 55 million in the last 20 years, the number of crimes have decreased by over 4 million.
Table 6.3: U.S. Crime Rates Over Time
|
Year |
Population Size |
Number of Violent Crime Incidences |
Violent Crime Rate * |
Number of Property Crime Incidences |
Property Crime Rate * |
|
1997 |
267,783,607 |
1,636,096 |
611.0 |
11,558,475 |
4,326.3 |
|
2002 |
287,973,924 |
1,423,677 |
494.4 |
10,455,277 |
3,630.6 |
|
2007 |
301,621,157 |
1,422,970 |
471.8 |
9,882,212 |
3,276.4 |
|
2012 |
313,873,685 |
1,217,057 |
387.8 |
9,001,992 |
2,868.0 |
|
2016 |
323,127,513 |
1,248,185 |
386.3 |
7,919,035 |
2,450.7 |
*Violent Crime and Property Crime Rates show the number of crime victims per every 100,000 in the population
Source: Data from Federal Bureau of Investigations. Retrieved from https:// ucr.fbi.gov/crime-in-the-u.s/2016/crime-in-the-u.s.-2016
However, one thing to keep in mind is that these figures are in fact lower than the actual crime rate because, according to surveys of random samples of crime victims, more than half of all crime victims do not report their crimes to the police, leaving the police unaware of the crimes. For instance, based on data from the National Crime Victims Survey, the Bureau of Justice Statistics estimated that in 2016, only 42.1% of violent crimes were reported to the police and that only 35.7% of property crimes were reported. Underreporting varies by the type of crime. For instance, rapes and sexual assaults were found to be reported to the police only 22.9% of the time, while motor vehicle thefts were reported 79.9% of the time (Morgan & Kena, 2017). Reasons for non-reporting include the belief that police will not be able to find the offender and fear of retaliation by the offender. The true crime problem is therefore greater than suggested by the UCR.
This underreporting of crime represents a major problem for the UCR’s validity. Several other problems exist (Lynch & Addington, 2007). First, the UCR omits crime by corporations and thus diverts attention away from their harm (see a little later in this chapter). Second, police practices affect the UCR. For example, the police do not record every report they hear from a citizen as a crime. Sometimes they have little time to do so, sometimes they do not believe the citizen, and sometimes they deliberately fail to record a crime to make it seem that they are doing a good job of preventing crime. If they do not record the report, the FBI does not count it as a crime. If the police start recording every report, the official crime rate will rise, even though the actual number of crimes has not changed. In a third problem, if crime victims become more likely to report their crimes to the police, which might have happened after the 911 emergency number became common, the official crime rate will again change, even if the actual number of crimes has not changed.
The Types and Correlates of Crime and Victimization
Data sources give us a fairly good understanding of the types of crime, of who does them and who is victimized by them, and of why the crimes are committed. We have already looked at the “why” question when we reviewed the many theories of deviance. Let’s look now at the various types of crime and highlight some important things about them.
One type of crime is , which are the violent and property offenses that worry average citizens more than any other type of crime. The number of violent and property crimes in the U.S. in 2016 amounted to over 9 million, according to FBI data (or more, given the underreporting discussed above). In addition to the physical toll on victims of such crimes the cost to victims amounts to almost $20 billion each year in property losses, medical expenses, and time lost from work.
Rates of violent crime victimization in 2016 were fairly close for males and females. For males, the rate of total violence per 1,000 persons aged 12 or older was 21.4, while for females the figure was 20.8 (Morgan & Kena, 2017). However, when looking at differences in violent crime victimization by race, age and household income, the differences are stark, as shown below in Figure 6.2: “Correlates of Violent Crime Victimization, 2016.” The tables below demonstrate that the rate of crime victimization varies by race, with African Americans, American Indians, Alaska Natives and multiracial people disproportionately impacted. Similarly, younger people and lower income individuals are more likely to be victimized.
Figure 6.2 Correlates of Violent Crime Victimization, 2016
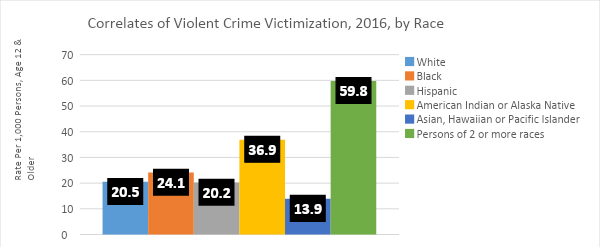

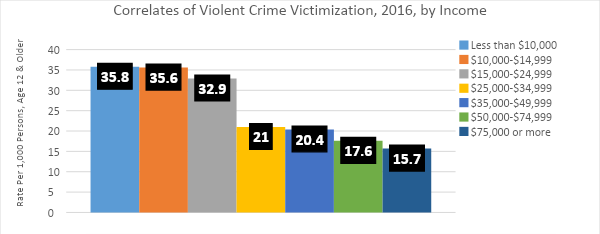
Source: Data from Morgan, R. E. and Kena, G. Criminal Victimization, 2016. Washington, DC: Bureau of Justice Statistics, U.S. Department of Justice. https://www.bjs.gov/content/pub/pdf/cv16.pdf
Similarly, the rate of violent crime victimization varies by location of residence. Violent crime is more common in urban areas than in rural and suburban communities. The rate of violent crime victimization in urban areas is 29.9 per 1,000 persons aged 12 or older, and 15.4 and 21.7 in suburban and rural areas, respectively. It varies geographically in at least one other respect, and that is among the regions of the United States. Rates of violent crime victimization in 2016 were highest in the Midwest and West, and lowest in the Northeast and South (Morgan & Kena, 2017).

Rates of violent crime victimization are higher in urban areas. Aurelien Guichard – New York City – CC BY-SA 2.0.
When it comes to crime, we fear strangers much more than people we know, but crime data suggests our fear is somewhat misplaced (Truman & Rand, 2010). In cases of assault, rape, or robbery, data shows that strangers commit only about 42% of these offenses, meaning that 58% of the offenses, or well over half, are committed by someone the victim knows. Another important fact about conventional crime is that most of it is intraracial, meaning that the offender and victim are usually of the same race. For example, 84% of all single offender–single victim homicides in 2009 involved persons who were either both white or both African American (Federal Bureau of Investigation).
Who is most likely to commit conventional crime? Data collected by the FBI from police departments nationwide show that a disproportionate number of crimes are committed by males, with the exceptions of larceny-theft, embezzlement and prostitution. Of the 8.3 million people arrested in 2015, 6.1 million were male, or 73.1% of all arrests (Federal Bureau of Investigation, 2015). Table 6.4: “Arrests by Sex, 2015” shows examples of this difference.
Table 6.4 Arrests by Sex 2015
|
Offense Charged |
# of Arrests |
Percent Male |
Percent Female |
|
Murder |
8,533 |
88.5 |
11.5 |
|
Rape |
17,504 |
97.1 |
2.9 |
|
Robbery |
73,230 |
85.6 |
14.4 |
|
Aggravated Assault |
288,815 |
76.9 |
23.1 |
|
Burglary |
166,609 |
81.1 |
18.9 |
|
Larceny-Theft |
900,077 |
56.8 |
43.2 |
|
Motor Vehicle Theft |
59,831 |
78.8 |
21.2 |
|
Arson |
6,802 |
80.3 |
19.7 |
|
Forgery and Counterfeiting |
42,681 |
64.7 |
35.3 |
|
Fraud |
102,339 |
61.3 |
38.7 |
|
Embezzlement |
12,247 |
49.8 |
50.2 |
|
Weapons; carrying, possessing, etc. |
111,316 |
91.1 |
8.9 |
|
Prostitution |
31,534 |
36.0 |
64.0 |
|
Drug Abuse Violations |
1,144,021 |
77.4 |
22.6 |
|
Offenses against family and children |
72,418 |
71.3 |
28.7 |
|
D. U. I. |
833,833 |
75.1 |
24.9 |
|
Drunkenness |
314,856 |
80.5 |
19.5 |
|
Disorderly Conduct |
298,253 |
71.8 |
28.2 |
Source: Data from Federal Bureau of Investigation. (2015). Crime in the United States, 2015. Washington, DC: Author. Retrieved from: https://ucr.fbi.gov/crime-in-the-u.s/2015/crime-in-the-u.s.-2015/tables/table-42
Despite much controversy over what racial differences in arrest mean, rates of arrests vary by racial-ethnic group. The rate of arrest for both Non-Hispanic whites and African Americans were disproportionately higher than their overall population size. For instance, the non-Hispanic white population in 2016 was 61.3% of the total U.S. population, yet non-Hispanic whites made up 69.6% of all arrests in the nation. Similarly, the African American population was 12.7% of the overall population in 2016, while 26.9% of arrests were of African Americans in that same year. Table 6.5: “Arrests by Race and Ethnicity, 2016” shows rates of arrest for U.S. racial and ethnic groups, along with their portion of the overall population.
Table 6.5: Arrests by Race and Ethnicity, 2016
|
Racial-Ethnic Group |
% of the U.S. Population |
% of Arrests* |
|
White |
61.3 |
69.6 |
|
Hispanic/Latino |
17.8 |
18.4 |
|
African American |
12.7 |
26.9 |
|
Asian American |
4.8 |
1.2 |
|
American Indian or Alaska Native |
.9 |
2.0 |
|
Native Hawaiian or Pacific Islander |
.2 |
.3 |
*% of arrests are broken down by race and by ethnicity by the FBI. The percentage for the Hispanic/Latino population is compared with other non-Hispanic/Latino ethnic groups. All other groups above are listed as racial groups and are compared to other racial groups. This is why the % of Arrests column does not add up to 100%.
Source: Data from the Federal Bureau of Investigation. (2016). Crime in the United States, 2016. Washington, DC: Author. Retrieved from: https://ucr.fbi.gov/crime-in-the-u.s/2016/crime-in-the-u.s.-2016/resource-pages/tables/table-21
Social class also plays a role in conventional crime rates. Most people arrested for conventional crime have low levels of education and low incomes. Such class differences in arrest can be explained by several of the explanations of deviance already discussed, including strain theory. Note, however, that wealthier people commit most white-collar crimes. If the question is whether social class affects crime rates, the answer depends on what kind of crime we have in mind.
One final factor affecting conventional crime rates is age. The evidence is very clear that conventional crime is disproportionately committed by people age 30 and under. For example, people in the 10–29 age group account for about 49.8% of all arrests (Federal Bureau of Investigation, 2017). During adolescence and young adulthood, peer influences are especially strong and “stakes in conventional activities,” to use some sociological jargon, are weak. Once we start working full time and possibly get married, our stakes in society become stronger and our sense of responsibility grows. We soon realize that breaking the law might be much costlier than when we were young.
White-Collar Crime
is crime committed as part of one’s occupation. It ranges from fraudulent repairs by auto repair shops to corruption in the high-finance industry to unsafe products and workplaces in some of our largest corporations. It also includes employee theft of objects and cash. Have you ever taken something without permission from a place where you worked? Whether or not you have, many people steal from their employees, and the National Retail Federation estimates that employee theft involves some $49 billion annually (National Retail Federation, 2017). White-collar crime also includes health-care fraud, which is estimated to cost some $100 billion a year as, for example, physicians and other health-care providers bill Medicaid for exams and tests that were never done or were unnecessary (Rosoff, Pontell, & Tillman, 2010). And it also involves tax evasion: the IRS estimates that tax evasion costs the government some $400 billion annually, a figure many times greater than the cost of all robberies and burglaries (Matthews, 2016).
One of the most serious recent examples of white-collar crime came to light in December 2008, when it was discovered that 70-year-old investment expert Bernard Madoff had engaged in a Ponzi scheme (in which new investments are used to provide the income for older investments) since the early 1990s in which he defrauded thousands of investors of an estimated $50 billion, the largest such scandal in U.S. history (Creswell & Thomas, 2009). Madoff pleaded guilty in February 2009 to 11 felonies, including securities fraud and money laundering, and was sentenced to 150 years in prison (Henriques & Healy, 2009).

In June 2009, investment expert Bernard Madoff was sentenced to 150 years in prison for defrauding thousands of investors of tens of billions of dollars. This was the largest such crime in U.S. history. Wikimedia Commons – public domain.
Some of the worst crimes are committed by our major corporations, known as . As just one example, price fixing in the corporate world costs the U.S. public about $60 billion a year (Simon, 2006). Even worse, an estimated 50,000 workers die each year from workplace-related illnesses and injuries that could have been prevented if companies had obeyed regulatory laws and followed known practices for safe workplaces (AFL-CIO, 2007). A tragic example of this problem occurred in April 2010, when an explosion in a mining cave in West Virginia killed 29 miners. It was widely thought that a buildup of deadly gases had caused the explosion, and the company that owned the mine had been cited many times during the prior year for safety violations related to proper gas ventilation (Urbina, 2010).
Corporations also make deadly products. In the 1930s the asbestos industry first realized their product was dangerous but hid the evidence of its danger, which was not discovered until 40 years later. In the meantime, thousands of asbestos workers came down with deadly asbestos-related disease, and the public was exposed to asbestos that was routinely put into buildings until its danger came to light.
Asbestos is not the only unsafe product. The Consumer Product Safety Commission and the U.S. Centers for Disease Control and Prevention estimate that about 10,000 Americans die annually from dangerous products, including cars, drugs, and food (U.S. Consumer Product Safety Commission, 2003; Petersen & Drew, 2003). In perhaps the most notorious case, Ford Motor Company marketed the Pinto even though company officials knew the gas tank could catch fire and explode when hit from the rear end at low speeds. Ford had determined it could fix each car’s defect for $11 but that doing so would cost it more money than the amount for lawsuits it would eventually pay to the families of dead and burned Pinto victims if it did not fix the defect. Because Ford decided not to fix the defect, many people—estimates range from two dozen up to 500—people died in Pinto accidents (Cullen, Maakestad, & Cavender, 2006). In a more recent example involving a motor vehicle company, Toyota was fined $16.4 million by the federal government in April 2010 for allegedly suppressing evidence that its vehicles were at risk for sudden acceleration. The government’s announcement asserted that Toyota “knowingly hid a dangerous defect for months from U.S. officials and did not take action to protect millions of drivers and their families” (Maynard, 2010, p. A1).
Corporations also damage the environment, as the BP oil spill that began in April 2010 reminds us. Because federal laws are lax or nonexistent, corporations can and do pollute the environment with little fear of serious consequences. According to one report, one-fifth of U.S. landfills and incinerators and one-half of wastewater treatment plants violate health regulations (Armstrong, 1999). It is estimated that between 50,000 and 100,000 Americans and 300,000 Europeans die every year from the side effects (including heart disease, respiratory problems, and cancer) of air pollution (BBC News, 2005); many of these deaths would not occur if corporations followed the law and otherwise did not engage in unnecessary pollution of the air, water, and land. Critics also assert that laws against pollution are relatively weak and that government enforcement of these laws is often lax.
Is white-collar crime worse than conventional crime? The evidence seems to say yes. A recent estimate put the number of deaths from white-collar crime annually at about 110,000, compared to 17,000 to 18,000 from homicide. The financial cost of white-collar crime to the public was also estimated at about $565 billion annually, compared to about $18 billion from conventional crime (Barkan, 2012). Although we worry about conventional crime much more than white-collar crime, the latter harms the public more in terms of death and financial costs.
Scholars attribute the high level of white-collar crime, and especially of corporate crime, to one or more of the following: (a) greed arising from our society’s emphasis on economic success, (b) the absence of strong regulations governing corporate conduct and a severe lack of funding for the federal and state regulatory agencies that police such conduct, and/or (c) weak punishment of corporate criminals when their crimes are detected (Cullen, Maakestad, & Cavender, 2006; Leaf, 2002; Rosoff, Pontell, & Tillman, 2010). Drawing on this understanding, many scholars think that more effective corporate regulation and harsher punishment of corporate criminals (that is, imprisonment in addition to the fines that corporations typically receive when they are punished) may help deter corporate crime.
Victimless Crime
is illegal behavior in which people willingly engage and in which there are no unwilling victims. The most common examples are drug use, prostitution, pornography, and gambling. Many observers say these crimes are not really victimless, even if people do engage in them voluntarily. For example, many drug users hurt themselves and members of their family from their addiction and the physical effects of taking drugs. Prostitutes put themselves at risk for sexually transmitted disease and abuse by pimps and customers. Illegal gamblers can lose huge sums of money. Although none of these crimes is truly victimless, the fact that the people involved in them are not unwilling victims makes victimless crime different from conventional crime.
Victimless crime raises controversial philosophical and sociological questions. The philosophical question is this: should people be allowed to engage in behavior that hurts themselves (Meier & Geis, 2007)? For example, our society lets adults smoke cigarettes, even though tobacco use kills several hundred thousand people every year. We also let adults gamble legally in state lotteries, at casinos and racetracks, and in other ways. We obviously let people of all ages eat “fat food” such as hamburgers, candy bars, and ice cream. Few people would say we should prohibit these potentially harmful behaviors. Why, then, prohibit the behaviors we call victimless crime? Some scholars say that any attempt to decide which behaviors are so unsafe or immoral that they should be banned is bound to be arbitrary, and they call for these bans to be lifted. Others say that the state does indeed have a legitimate duty to ban behavior the public considers unsafe or immoral and that the present laws reflect public opinion on which behaviors should be banned.

Laws against illegal drug use and other victimless crimes raise several philosophical and sociological questions, including whether the laws do more harm than good. Blind Nomad – marijuana wars – weeds a stimulant – CC BY 2.0.
The sociological question is just as difficult to resolve: do laws against victimless crimes do more harm than good (Meier & Geis, 2007)? Some scholars say these laws in fact do much more harm than good, and they call for the laws to be abolished or at least reconsidered for several reasons: the laws are ineffective even though they cost billions of dollars to enforce, and they lead to police and political corruption and greater profits for organized crime. Laws against drugs further lead to extra violence, as gangs and other groups fight each other to corner the market for the distribution of drugs in various neighborhoods. The opponents of victimless crime laws commonly cite the example of Prohibition during the 1920s, where the banning of alcohol led to all of these problems, which in turn forced an end to Prohibition by the early 1930s. If victimless crimes were made legal, opponents add, the government could tax the behaviors now banned and collect billions of additional tax dollars.
Those in favor of laws against victimless crimes cite the danger these behaviors pose for the people engaging in them and for the larger society. If we made drugs legal, they say, even more people would use them, and even more death and illness would occur. Removing the bans against behaviors such as drug use and prostitution, these proponents add, would imply that these behaviors are acceptable in a civil society.
The debate over victimless crimes and victimless crime laws will not end soon, as both sides have several good points to make. One thing that is clear is that our current law enforcement approach is not working. More than 1 million people are arrested annually for drug use and trafficking and other victimless crimes, but there is little evidence that using the law in this manner has lowered people’s willingness to take part in victimless crime behavior (Meier & Geis, 2007). Perhaps it is not too rash to say that a serious national debate needs to begin on the propriety of the laws against victimless crimes to determine what course of action makes the most sense for American society.
|
Learning from Other Societies Crime and Punishment in Denmark and the Netherlands Since the 1970s the United States has used a get-tough approach to fight crime; a key dimension of this approach is mandatory sentencing and long prison terms and, as a result, a huge increase in the number of people in prison and jail. Many scholars say this approach has not reduced crime to a great degree and has cost hundreds of billions of dollars. The experience of Denmark and the Netherlands suggests a different way of treating criminals and dealing with crime. Those nations, like most others in Western Europe, think prison makes most offenders worse and should be used only as a last resort for the most violent and most incorrigible offenders. They also recognize that incarceration is very expensive and much more costly than other ways of dealing with offenders. These concerns have led Denmark, the Netherlands, and other Western European nations to favor alternatives to imprisonment for the bulk of their offenders. These alternatives include the widespread use of probation, community service, and other kinds of community-based corrections. Studies indicate that these alternatives may be as effective as incarceration in reducing recidivism (repeat offending) and cost much less than incarceration. If so, an important lesson from Denmark, the Netherlands, and other nations in Western Europe is that it is possible to keep society safe from crime without using the costly get-tough approach that has been the hallmark of the U.S. criminal justice system since the 1970s. (Bijleveld & Smit, 2005; Dammer & Fairchild, 2006) |
Key Terms
Conventional crime – crimes which involve violence or property offenses.
White-collar crime – crimes which are committed as part of one’s occupation.
Corporate crime – crimes which are committed by major corporations.
Victimless crime – illegal behavior in which people willingly engage and in which there are no unwilling victims.
Continue to 6.4 The Get-Tough Approach: Boon or Bust?
a form of deviance where an individual violates a law
a form of crime in which acts of violence or property offenses are committed
a form of crime committed as part of one’s occupation
crimes which are committed by major corporations
illegal behavior in which people engages and in which there are no unwilling victims
