Social Issues in the News
“Hunger Staring Country in the Face,” the headline said. Although India has been experiencing economic growth and is far from the poorest nation in the world, hunger remains a serious problem throughout the country. According to the news report, India’s economic numbers “could be masking the reality that growth has not translated into better lives for Indians.” Over 20% of Indians live below the international poverty line, defined by the World Bank as income under $1.90 per day. More than 200 million Indians, about one-fifth of the nation’s population, experience food insecurity, even though India is a leading producer of grains, fruits, and vegetables. More than 80 million Indian children are malnourished. According to the news report, India’s high hunger rate stems from its poverty, inadequate distribution of food, and political corruption. To help reduce hunger, the report said it was important to develop programs focused on women and children, who are especially likely to live in hunger. (Golikeri, 2010, p. MM28)
We learn several things from this news story about India: (a) poverty and hunger are common; (b) although India apparently has enough food to help feed its people, inadequate distribution and political corruption help keep food from the mouths of the hungry; (c) women and children bear the brunt of poverty and hunger; and, finally, (d) if India is far from the poorest nation and so many Indians are going hungry, conditions in poorer nations are likely far worse. In all these respects, India’s situation tells us much about global stratification and demography, the subjects of this chapter. We first discuss the dimensions and extent of global stratification before turning to its impact and possible reasons for it. We will see that many nations around the world are in, and have long been in, a dire situation, but we will also examine possible strategies for improving their situation.
Global Stratification
Stratification within the United States was discussed in Chapter 7 “Social Stratification and Social Class”. As we saw then, there is a vast difference between the richest and poorest segments of American society. Stratification also exists across the world. refers to the unequal distribution of wealth, power, prestige, resources, and influence among the world’s nations. Put more simply, there is an extreme difference between the richest and poorest nations. A few nations are very wealthy, while many more nations are poor. Reflecting this latter fact, 15% of the world’s population, or about 1.1 billion people, lives on less than $2 per day and are considered poor. In addition, 56% of the global population (4.1 billion people) are considered low income, living on $2.01 – 10 per day. This is in comparison to the 7% which are high-income, with incomes of $50 per day or more at their disposal (Alberti, 2015).
The world’s poor are concentrated regionally in sub-Saharan Africa and South Asia. For instance, several countries in Southeast Africa, such as Madagascar, Burundi and Tanzania, have more than 70% of their total population classified as poor, living on $2 per day or less. Conversely, in Northern Europe and North America, few experience this level of poverty, and the majority of these populations are considered high-income on the global income scale discussed above. The country of Norway has the highest percentage of its population considered high-income, with 77.2% of Norwegians in this category (Alberti, 2015).
Classifying Global Stratification
One way to visualize these disparities is to examine how income is distributed by quintiles. The richest fifth of the world’s population controls approximately three-fourths of the world’s income, while the poorest fifth of the world’s population have only 1.5% of the world’s income, and the poorest two-fifths have only 5.0% of the world’s total income (Dikhanov, 2005). As Figure 8.1 “Global Income Distribution (Percentage of World Income Held by Each Fifth of World Population)” illustrates, this distribution of income resembles a champagne glass.
Figure 8.1 Global Income Distribution (% of World Income Held by Each Fifth of World Population)

Source: Data from Dikhanov, Y. (2005). Trends in global income distribution, 1970–2000, and scenarios for 2015. New York, NY: United Nations Development Programme.
As these figures make clear, the world is indeed stratified. To understand global stratification, it is helpful to classify nations into three or four categories based on their degree of wealth or poverty, their level of industrialization and economic development, and related factors. Over the decades, scholars and international organizations such as the United Nations and the World Bank have used various classification systems, or typologies.
One of the first typologies came into use after World War II and classified nations as falling into the First World, Second World, and Third World. The First World was generally the Western capitalist democracies of North America and of Europe and certain other nations (e.g., Australia, New Zealand, and Japan). The Second World was the communist nations belonging to the Soviet Union, while the Third World was all the remaining nations, almost all of them from Central and South America, Africa, and Asia. This classification was useful in distinguishing capitalist and community countries and in calling attention to the many nations composing the Third World. However, it was primarily a political classification rather than a stratification classification. This problem, along with the demise of the Soviet Union by the end of 1991, caused this typology to fall out of favor.
Today a popular typology simply ranks nations by their level of economic strength into groups called high-income nations, middle-income nations and low-income nations. These categories are based on measures such as gross domestic product (GDP) per capita (the total value of a nation’s goods and services divided by its population). This typology has the advantage of emphasizing the most important variable in global stratification: how much wealth a nation has. At the risk of being somewhat simplistic, the other important differences among the world’s nations all stem from their degree of wealth or poverty.
Typologies based on GDP per capita or similar economic measures are very useful, but they also have a significant limitation. Nations can rank similarly on GDP per capita (or another economic measure) but still differ in other respects. One nation might have lower infant mortality, another might have higher life expectancy, and a third might have better sanitation. Recognizing this limitation, organizations such as the United Nations Development Programme (UNDP) use typologies based on a broader range of measures than GDP per capita. A very popular typology is the UNDP’s , which is a composite measure of a nation’s income, health, and education. This index is based on a formula that combines a nation’s GDP per capita as a measure of income; life expectancy at birth as a measure of health; and the adult literacy rate and enrollment in primary, secondary, and higher education as measures of education. Figure 8.2 “Human Development Index Map” shows how nations rank according to their HDI values. The closer the HDI number is to 1.0, the greater the well-being, and closer the HDI number is to 0.0, the lower the level of well-being.
Figure 8.2 Human Development Index Map

Source: Adapted from “Human Development Index.” Wikipedia, Wikimedia Foundation, 24 July 2018. CC BY-SA 4.0 Retrieved from https://en.wikipedia.org/wiki/Human_Development_Index#/media/File:2016_UN_Human_Development_Report.svg
As demonstrated above, countries with similar HDI scores tend to be geographically concentrated. For instance, in 2016, the countries ranked in the top 10 were all found in Europe, with the exceptions of Singapore (#5), Canada and the U.S. (tied at #10), while all countries ranked in the bottom 10 were found in sub-Saharan Africa. Table 8.1 “Human Development Index Data” shows the countries with the highest and lowest HDI values and some of the variables used to determine these values.
The HDI has been widely used since the 1990s and reminds us that nations differ dramatically not only in their economic well-being but also in their social well-being. However, because health, education, and other social indicators do depend so heavily on wealth, our discussion of global stratification for the remainder of this chapter will use the familiar classification of high-income, middle-income, and low-income nations. We now highlight the basic differences among these three categories of nations.
Table 8.1: Human Development Index Data
|
Country/Rank |
HDI Value |
Life Expectancy at Birth |
Expected Years of Schooling |
Gross National Income Per Capita |
|
Countries with the Highest HDI Values |
||||
|
Norway (1) |
.949 |
81.7 |
17.7 |
$67,614 |
|
Australia (2) |
.939 |
82.5 |
20.4 |
$42,822 |
|
Switzerland (2) |
.939 |
83.1 |
16.6 |
$45,000 |
|
Germany (4) |
.926 |
81.1 |
17.2 |
$45,000 |
|
Denmark (5) |
.923 |
80.4 |
19.2 |
$44,519 |
|
Singapore (5) |
.925 |
83.2 |
15.4 |
$78,162 |
|
Countries with the Lowest HDI Values |
||||
|
Burundi (184) |
.404 |
57.1 |
10.6 |
$691 |
|
Burkina Faso (185) |
.402 |
59.0 |
7.7 |
$1537 |
|
Chad (186) |
.396 |
51.9 |
7.3 |
$1991 |
|
Niger (187) |
.353 |
61.9 |
5.4 |
$889 |
|
Central African Republic (188) |
.352 |
51.5 |
7.1 |
$587 |
Source: data from “Human Development Reports.” | Human Development Reports, hdr.undp.org/en/composite/HDI. Retrieved from http://hdr.undp.org/en/composite/HDI
High-Income Nations
are typically post-industrial, and they consist primarily of the nations of North America and Western Europe; Australia, Japan, and New Zealand; and certain other nations in the Middle East (e.g., Kuwait, Qatar and the United Arab Emirates) and Asia (e.g., Japan and Singapore). Many of them were the first nations to become industrialized starting in the 19th century, when the Industrial Revolution began, and their early industrialization certainly contributed to the great wealth they enjoy today. Yet it is also true that many Western European nations were also wealthy before the Industrial Revolution, thanks in part to the fact that they had been colonial powers and acquired wealth from the resources of the lands and people they colonized. Due to this fact, one of the explanations for the establishment of global stratification is the fact of colonization (discussed further in 8.3 Explaining Global Stratification).
Although high-income nations constitute only about one-sixth of the world’s population, they hold about four-fifths of the world’s entire wealth. They are the leading nations in industry, high finance, and information technology and exercise political, economic, and cultural influence across the planet. As the global economic crisis that began in 2007 illustrates, when the economies of just a few wealthy nations suffer, the economies of other nations and indeed of the entire world can suffer. Although each of the world’s wealthy nations is internally stratified to a greater or lesser degree, these nations as a group live a much more comfortable existence than middle-income nations and, especially, low-income nations. People in high-income nations are healthier and more educated, and they enjoy longer lives. At the same time, high-income nations use up more than their fair share of the world’s natural resources, and their high level of industrialization causes them to pollute and otherwise contribute to climate change to a far greater degree than is true of nations in the other two categories.

Although there is much poverty in England, where this home is located, people in England and other wealthy nations live a much more comfortable existence than people in middle- and low-income nations. Anguskirk – Avington Park mansion in Hampshire – CC BY-NC-ND 2.0.
Middle-Income Nations
are generally industrialized, although the level of industrialization ranges significantly. They consist primarily of nations in Central and South America, Eastern Europe, and parts of Africa and Asia, and constitute about one-third of the world’s population. Many of these nations have abundant natural resources but still have high levels of poverty, partly because leaders sell the resources to wealthy nations and keep much of the income from these sales for themselves.
There is much variation in income and wealth within the middle-income category, even within the same continent. In Central America, for example, the gross national income per capita of the middle-income neighboring countries of Costa Rica and Nicaragua in 2017 were $15,750 and $5,390, respectively (Population Reference Bureau, 2017). Many international organizations and scholars thus find it useful to further divide middle-income nations into upper-middle-income nations and lower-middle-income nations. Not surprisingly, many more people in the latter nations live in dire economic circumstances than those in the former nations. In Nicaragua, for example, 86.1 % of the population are poor or low-income, compared to 43.5% in Costa Rica.

Many middle-income nations are rich in natural resources but still have high levels of poverty. saf2285 – Coloured houses in Valparaiso – CC BY 2.0.
Low-Income Nations
are the least industrialized and most agricultural of all the world’s countries. This category consists primarily of nations in Africa and parts of Asia and constitutes roughly half of the world’s population. They have some natural resources that political leaders again sell to wealthier nations while keeping much of the income they gain from these sales. Many of these nations rely heavily on one or two crops, and if weather conditions render a crop unproductive in a particular season, the nations’ hungry may experience famine. By the same token, if economic conditions reduce the price of a crop or other natural resource, the income from exports of these commodities plummets, and these already poor nations become even poorer. An example of this latter problem occurred in Vietnam, a leading exporter of coffee. As coffee prices rose during the 1990s, Vietnam expanded its coffee production by greatly increasing the amount of acreage devoted to growing coffee beans. When the price of coffee plummeted in the early 2000s, Vietnam’s coffee industry, including the farmers who grow coffee, suffered huge losses. Many farmers destroyed their coffee plants to be able to grow other crops they thought would be more profitable (Huy, 2010). Because farmers in poor nations often change their crops in this manner for economic reasons, it is difficult for these nations to sustain a stable agricultural industry.

Access to clean water is a major concern in low-income nations. United Nations Photo – Maslakh Camp for Displaced, Afghanistan – CC BY-NC-ND 2.0.
By any standard, many people in these nations face grave challenges. They may suffer from AIDS, malaria and other deadly diseases, are often malnourished, and lack indoor plumbing, electricity, and other modern conveniences that most of us take for granted.
Global Poverty
In addition to classifying nations according to their ranking on a stratification typology, scholars and international organizations also determine the level of poverty in each nation. This determination provides valuable information beyond a nation’s GDP per capita or similar measure of wealth. Wealth and poverty are, of course, highly correlated: generally speaking, the wealthier a nation, the lower its level of poverty. However, this correlation is not perfect, and considering nations only in terms of their wealth may obscure important differences in their levels of poverty. For example, two nations, which we will call Nation A and Nation B, may have similar GDP per capita. In Nation A, wealth from its GDP is fairly evenly distributed, and relatively few people are poor. In Nation B, almost all wealth is held by a small number of incredibly rich people, and many people are poor. A nation’s level of poverty thus tells us what proportion of the population is living in impoverished conditions, regardless of the nation’s level of wealth.
Although it is important, then, to measure the poverty level of the nations of the world, it is rather difficult to do so. One problem is that the different nations have different standards of living. If an American woman who has a family to feed earns $10 per day, or about $3,650 per year, she and her family are very poor by American standards. However, a woman who earns the equivalent of $10 per day in many poor nations may be well off by those nations’ standards, and she would be able to afford many more goods and services than her American counterpart.
Another problem was first encountered in Chapter 7 “Social Stratification and Social Class” in the discussion of poverty in the United States. No matter what income level might be used as an “official” poverty line for the nations of the world, this level is inevitably an arbitrary number. An individual or family whose income is just a bit above the official poverty line is not counted as being officially poor, even though they are still poor for all practical purposes. Moreover, the most common measures of official global poverty ignore . Individuals and families may move into and out of poverty within a given year or two, often more than once. Measures of global poverty (as well as measures of U.S. poverty) determine the number of poor people at one point in time and thus provide an underestimate of the number of people who are poor at least once in a given year.
A third problem concerns exactly what is meant by poverty. Although poverty is usually thought of in monetary terms, some analysts emphasize that poverty involves things in addition to money, such as inadequate nutrition and illiteracy. These analysts favor using measures such as calorie consumption or level of malnutrition as indicators of poverty.
How, then, is global poverty measured? A very common and popular measure is one used by the World Bank, an international institution, funded by wealthy nations, that provides loans, grants, and other aid to help poor and middle-income nations develop their infrastructure and thus reduce their poverty. The World Bank puts the official global poverty line (which is considered a measure of absolute poverty) at income under $1.90 per person per day (updated in 2015), which amounts to about $694 yearly per person or $2,774 for a family of four. is the level of poverty at which an individual is struggling to meet basic needs, such as having adequate nutrition and shelter. According to the World Bank, in 2013, 10.7% of the world’s population were in absolute poverty, which equated to 766 million people. Eighty-percent of people in absolute poverty live in rural communities, they are disproportionately young (44% are 14 years old or younger), poorly educated and employed in agriculture (2016).
Poverty Indexes
In addition to the Human Development Index discussed earlier in this chapter, the United Nations Development Programme (UNDP) also developed a similar measure to measure global poverty called the (MPI). This measure reflects the UNDP’s belief that poverty means more than a lack of money and that measures of poverty must include nonmonetary components of social well-being. Accordingly, the MPI incorporates a range of deprivation measures applied to each nation’s households. Households are considered poor according to their composite score on three categories of indicators of deprivation:
- Health
- Child mortality (any child in the household has died)
- Nutrition (anyone in the family is malnourished)
- Education
- Schooling (no household member has completed 5 years of schooling)
- Enrollment (any child in the family is not in school before grade 9)
- Standard of living
- Electricity (the household does not have electricity)
- Drinking water (the household does not have access to clean drinking water)
- Sanitation (the household does not have adequate disposal of human waste)
- Flooring (the floor is made out of dirt, sand, or manure [dung])
- Cooking fuel (the household cooks with charcoal, dung, or wood)
- Assets (the household doesn’t own more than one bicycle, motorbike, radio, phone or T.V.)
A person is considered poor if he or she experiences deprivation in any of the following combinations of indicators:
- any two health and/or education indicators, or
- all six standard of living indicators, or
- one health/education indicator plus three standard of living indicators.
When the MPI is used to measure poverty, of the 102 countries examined, almost 1/3 of the population of these nations live in multidimensional poverty. Half of the poor people on the planet according to the MPI live in South Asia, and one-fourth live in Africa (Alkire & Santos, 2010). The five poorest nations according to the MPI are all African: Niger, South Sudan, Ethiopia, Chad and Burkina Faso. In these nations, at least 82% of the population lives in poverty.
Global Inequality
As first discussed in Chapter 7 “Social Stratification”, another dimension of stratification is , which refers to the gap between the richest and poorest segments of society. We saw then that the United States has more economic inequality than other Western democracies, as the income and wealth difference between the richest and poorest people in the United States is greater than that in these other nations.
As this discussion suggested, to understand stratification it is important to understand economic inequality. Global economic inequality (hereafter global inequality) has two dimensions. The first dimension involves the large economic gap between the high- and low-income nations of the world, as discussed earlier in this chapter. The second form of global inequality involves comparisons of the degree of economic inequality found within each nation. This type of information adds a valuable complement to measures of wealth (e.g., GDP per capita) and measures of poverty (e.g., the World Bank’s $1.90 per person per day). For example, Nation A and Nation B may have similar levels of poverty. In Nation A, however, poverty is evenly distributed throughout the population, and almost everyone is poor. In Nation B, a small segment of the population is very rich, while a much larger segment is very poor. Nation B would thus have more economic inequality than Nation A.
Around the world, inequality is generally higher in agricultural nations (or those that are low- or middle-income) and lower in high-income nations. In agricultural societies, a small elite usually owns most of the land and is very wealthy, and the masses of people either work for the elite or on their own small, poor farms. Industrial societies have lower inequality because they have higher literacy rates and more political rights and because they generally provide more opportunity for people to move up the socioeconomic ladder (Nolan & Lenski, 2009).
The most popular measure of economic inequality, and one used by the World Bank, is the . Its calculation need not concern us, but it ranges from 0 to 1, where 0 means that income is the same for everyone (no economic inequality at all, or perfect equality), and 1 means that one person has all the income (perfect inequality). Thus, the nearer the Gini coefficient is to 1, the higher the degree of a nation’s economic inequality. Figure 8.3 “Gini Coefficients, 2014” shows Gini coefficients around the world; economic inequality is indeed higher in the agricultural regions of Latin America and the Caribbean, Africa and South Asia than in the industrial and post-industrial regions.
Figure 8.3 Gini Coefficients, 2014
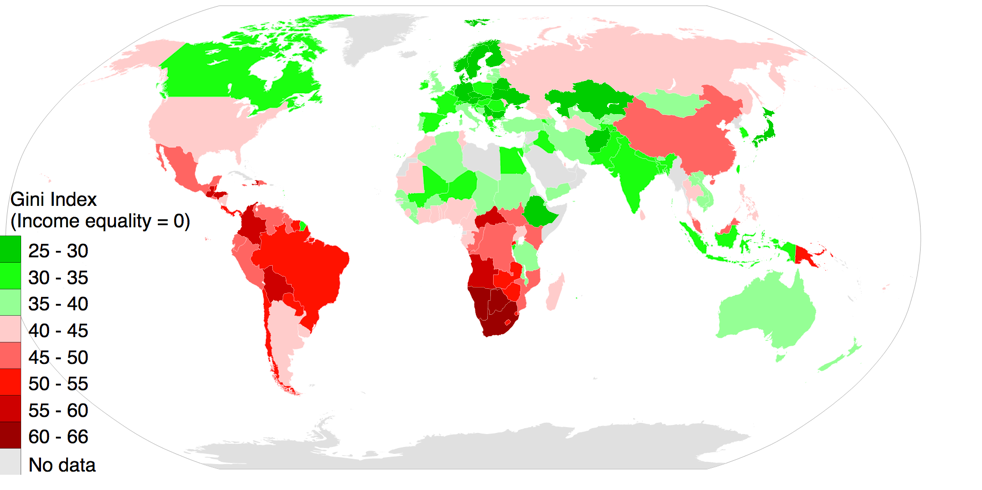
Source: Adapted from https://commons.wikimedia.org/wiki/File:2014_Gini_Index_World_Map,_income_inequality_distribution_by_country_per_World_ Bank.svg
Key Terms
Absolute Poverty – the level of poverty at which an individual is struggling to meet basic needs, such as adequate nutrition and shelter.
Economic Inequality – the gap between the richest and poorest segments of society.
Episodic Poverty – occurs when individuals and families move into and out of poverty within a given year or two, often more than once.
Gini Coefficient – a measure used by the World Bank to determine the degree of economic inequality that exists in a nation.
Global Stratification — the unequal distribution of wealth, power, prestige, resources, and influence among the world’s nations.
High-Income Nation – post-industrial nations with high levels of economic, political and cultural power at the global level and high use of the world’s natural resources. Typically found in Western Europe, North America and East Asia.
Human Development Index – composite measure of a nation’s income, health and education.
Low-Income Nation – least industrialized nations which primarily subsist on agricultural production, characterized by high levels of poverty and economic and political marginalization.
Middle-Income Nation – industrial nations with a mid-level of economic development found typically in Latin American and the Caribbean, Northern and Southern Africa, Eastern Europe and parts of Asia.
Multidimensional Poverty Index – A composite measure accounting for social well-being used to the United Nations Development Programme to measure poverty.
Continue to 8.2. The Impact of Global Poverty
the unequal distribution of wealth, power, prestige, resources, and influence among the world’s nations
a composite measure of a nation’s income, health and education
post-industrial nations, typically found in Western Europe, North America and East Asia, with high levels of economic, political and cultural power at the global level and high use of the world’s natural resources.
industrial nations with a mid-level of economic development found typically in Latin America and the Caribbean, Northern and Southern Africa, Eastern Europe and parts of Asia
least industrialized nations which primarily subsist on agricultural production, characterized by high levels of poverty and economic and political marginalization
occurs when individuals and families move into and out of poverty within a given year or two, often more than once
the level of poverty at which an individual is struggling to meet basic needs, such as adequate nutrition and shelter
a composite measure accounting for social well-being used by the United Nations Development Programme to measure poverty
the gap between the richest and poorest segments of society
a measure used by the World Bank to determine the degree of economic inequality that exists in a nation
