In his classic book The Other America, Michael Harrington (1962) brought the reality of poverty home to many Americans. In chapter after chapter, he discussed the troubled lives of the poor in rural Appalachia, in our urban centers, and in other areas of the country, and he indicted the country for not helping the poor. His book helped kindle interest in the White House and Congress in aiding the poor and deeply affected its thousands of readers. Almost five decades later, we know much more about poverty than we used to. Despite initial gains in fighting poverty in the 1960s (Schwartz, 1984), poverty is still with us and has worsened since the early 2000s, especially since the onset of the serious economic recession that began in 2008. What do we know about the extent of poverty, the reasons for it, and its consequences?
Economic Inequality
Let’s start by discussing , which refers to the extent of the economic difference between the rich and the poor. Because most societies are stratified, there will always be some people who are richer or poorer than others, but the key question is how much richer or poorer they are. When the gap between them is large, we say that much economic inequality exists; when the gap between them is small, we say that relatively little economic inequality exists.
Considered in this light, the United States has a very large degree of economic inequality, which is becoming concentrated at the top. A common way to examine inequality is to rank the nation’s families by income from lowest to highest and then to divide this distribution into fifths (or quintiles). Thus, we have the poorest fifth of the nation’s families (or the 20% of families with the lowest family incomes), a second fifth with somewhat higher incomes, and so on until we reach the richest fifth of families, or the 20% with the highest incomes. We then can see what percentage each fifth has of the nation’s entire income. Additionally, we can track this data over time in order to determine the degree to which income distribution changes and whether or not income share is concentrating in any one group. Table 7.4 “Share of National Aggregate Income Going to Income Fifths, 1970 – 2016” shows this data for the United States. In 2016, the poorest fifth enjoyed only 3.1% of the nation’s income, while the richest fifth enjoyed 51.5% (United States Census Bureau). Another way of saying this is that the richest 20% of the population have more income as the remaining 80% of the population. Additionally, comparing data from 1970 to the present, we can see that for the bottom 80%, their share of income has been declining over the past 5 decades, while the only group seeing an increased share of income is the top 20%.
Table 7.4 Share of National Aggregate Income Going to Income Fifths, 1970 – 2016
|
|
Lowest 20% |
Second 20% |
Third 20% |
Fourth 20% |
Highest 20% |
Top 5% |
|
1970 |
4.1 |
10.8 |
17.4 |
24.5 |
43.3 |
16.6 |
|
1980 |
4.2 |
10.2 |
16.8 |
24.7 |
44.1 |
16.5 |
|
1990 |
3.8 |
9.6 |
15.9 |
24.0 |
46.6 |
18.5 |
|
2000 |
3.6 |
8.9 |
14.8 |
23.0 |
49.8 |
22.1 |
|
2010 |
3.3 |
8.5 |
14.6 |
23.4 |
50.3 |
21.3 |
|
2016 |
3.1 |
8.3 |
14.2 |
22.9 |
51.5 |
22.6 |
Source: Data from US Census Bureau. “Historical Income Tables: Households.” www.census.gov/data/tables/time-series/demo/income-poverty/historical-income-households.html.
This degree of income inequality is the largest in the industrialized world. Below, Figure 7.6 “Distribution of Family Income, GINI Index” compares the inequality among several industrialized nations by examining their GINI Index. This index measures the degree of inequality in the distribution of family income, where the closer the score is to 0, the more equal the society, and the closer the score is to 100, the more unequal the society. The index number for the United States, 45.0, which far exceeds comparable nations, whose scores range from 26.8 to 35.9.
Figure 7.6 Distribution of Family Income, GINI Index

Source: Data from “Country Comparison : Distribution of Family Income – GINI Index.” Central Intelligence Agency, www.cia.gov/library/publications/the-world-factbook/rankorder/2172rank.html. Data retrieved from https://www.cia.gov/library/publications/the-world-factbook/rankorder/2172rank.html
As demonstrated, income inequality in the United States is greater than in comparable nations and has increased during the last several decades. The loss of manufacturing jobs and changes in taxation and income distribution policies since the early 1980s have favored the rich and hurt the economic standing of the middle, working and lower classes (Barlett & Steele, 2002; Wilson, 2009). As the saying goes, the rich get richer. To recall our earlier discussion, to be upwardly mobile, it helps to be well-off to begin with.
Measuring Poverty
When U.S. officials became concerned about poverty during the 1960s, they quickly realized they needed to find out how much poverty we had. To do so, a measure of official poverty, or a , was needed. This line was first calculated in 1963 by multiplying the cost of a very minimal diet by three, as a 1955 government study had determined that the typical American family spent one-third of its income on food. Thus, a family whose income is lower than three times the cost of a very minimal diet is considered officially poor.
This way of calculating the poverty line has not changed since 1963, even though many other things, such as energy, transportation, housing, child care, and health care, now occupy a greater percentage of the typical family’s budget than was true in 1963. As a national measure, the poverty line also fails to consider regional differences in the cost of living. As a recent report observed, “Most poverty analysts strongly believe that the official poverty statistics are inadequate to the task of determining who is poor in America” (Mishel, Bernstein, & Shierholz, 2009, p. 298).
Table 7.5 2018 Poverty Thresholds (for the 48 Contiguous States and the District of Columbia)
|
Family Size |
Poverty Guideline |
|
1 |
$12,140 |
|
2 |
$16,460 |
|
3 |
$20,780 |
|
4 |
$25,100 |
|
5 |
$29,420 |
|
6 |
$33,740 |
|
7 |
$38,060 |
|
8 |
$42,380 |
Source: Data from “Poverty Guidelines.” ASPE, 12 Jan. 2018, aspe.hhs.gov/poverty-guidelines. Retrieved from https://aspe.hhs.gov/poverty-guidelines
The poverty line is adjusted annually for inflation and takes into account the number of people in a family: the larger the family size, the higher the poverty line, as indicated in Table 7.5 “2018 Poverty Thresholds (for the 48 Contiguous States and the District of Columbia).” In 2018, the poverty line for a family of four is $25,100. A four-person family earning even one more dollar than $25,100 in 2018 is not officially poor, even though its “extra” income hardly lifted it out of dire economic straits.
Policy experts have calculated a no-frills budget that enables a family to meet its basic needs in food, clothing, shelter, and so forth; this budget is about twice the poverty line. Families with incomes between the poverty line and twice the poverty line are barely making ends meet, but they are not considered officially poor. When we talk here about the poverty level, keep in mind that we are talking only about official poverty and that there are many families and individuals living in near-poverty who have trouble meeting their basic needs, especially when they face unusually high medical, motor vehicle expenses or the like. For this reason, some analyses use “” or “low income” data (i.e., defined as family incomes below double the poverty line) to provide a more accurate understanding of how many Americans face financial difficulties.
The Extent and Social Distribution of Poverty
With this caveat in mind, how many Americans are poor, and who are they? The U.S. Census Bureau gives us some answers. In 2016, 12.7% of the U.S. population, or almost 40.6 million Americans, officially lived in poverty (Semega, Fontenot & Kollar, 2016). This percentage represented a decline from the peak of the economic recession beginning in 2007-2008 (see Figure 7.7 “Number in Poverty and Poverty Rate, 1959 – 2016), however, examining the chart below demonstrates that the percentage of people in poverty, while fluctuating a few percentage points, has remained fairly stable since the late-1970s. At the same time, the U.S. population has grown, resulting in a greater number of people in poverty (note below that around 1970, there were roughly 25 million people in poverty compared to 40.6 million today).
Figure 7.7 Number in Poverty and Poverty Rate, 1959 – 2016

Wikimedia Commons – Public Domain. Retrieved from: https://commons.wikimedia.org/wiki/File:Number_in_Poverty_and_Poverty_Rate_1959_to_2011._United_States..PNG
Poverty estimates are determined by way of a series of surveys of approximately 100,000 addresses per year, conducted in February, March and April. Because of this technique, episodic poverty may be undercounted. is defined by the Census Bureau as being poor for at least 2 consecutive months in some time period. For instance, from 2004 to 2007 the official poverty rate hovered around 13%, however in reality, almost one-third of the U.S. public, equal to about 95 million people, were poor for at least 2 consecutive months (DeNavas-Walt, Proctor, & Smith, 2010). As these figures indicate, people go into and out of poverty, but even those who go out of it do not usually move very far from it.
Poverty by Race and Ethnicity
Who are the poor? As shown in Figure 7.8 “Racial and Ethnic Composition of the Poor, 2016” the most typical poor person in the United States is white: in 2016 approximately 42.5% of poor people were white (non-Latino), 27.4% were Latino, 22.7% were African American, and 4.7% were Asian American (Semega, Fontenot & Kollar, 2016).
Figure 7.8 “Racial and Ethnic Composition of the Poor, 2016”

Source: Data from Semega, Jessica L., Fontenot, Kayla R. and Kollar, Melissa A. U.S. Census Bureau Current Population Reports, P60-259. “Income and Poverty in the United States: 2016.” U.S. Government Printing Office, Washington, DC. Data retrieved from https://www.census.gov/content/dam/Census/library/publications/2017/demo/P60-259.pdf
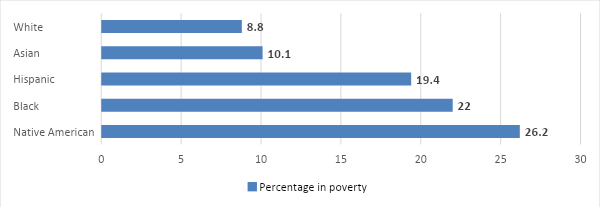
While, in terms of sheer numbers, there are more poor white Americans than other racial-ethnic groups, it’s important to examine the proportion of impoverished people in each of these groups. Race and ethnicity affects the chances of being poor, as shown below in Figure 7.9 “Race, Ethnicity, and Poverty, 2016 (Percentage of Each Group That Is Poor). This chart shows us that in 2016, 8.8% of non-Latino whites were poor, while 26.2% of Native Americans, 22% of African Americans, 10.1% of Asian Americans, and 19.4% of Latinos (who may be of any race) fell into this category. Thus, all racial-ethnic minorities in the U.S. are disproportionately poor, in comparison to the dominant white racial group. Native Americans are roughly three times as likely as non-Latino whites to be poor, while the rates of poverty of African Americans and Latinos are more than double the non-Latino white rate.
Figure 7.9 “Race, Ethnicity, and Poverty, 2016 (Percentage of Each Group That Is Poor)
Source: Data from Semega, Jessica L., Fontenot, Kayla R. and Kollar, Melissa A. U.S. Census Bureau Current Population Reports, P60-259. “Income and Poverty in the United States: 2016.” U.S. Government Printing Office, Washington, DC. Data retrieved from https://www.census.gov/content/dam/Census/library/publications/2017/demo/P60-259.pdf
Poverty by Age
Turning to age, 21% of children under age 18 are poor (amounting to more than 15 million children). According to the National Center for Children in Poverty, the poverty threshold dramatically underestimates the needs of families and, “on average, families need an income of about twice that level to cover basic expenses. Using this standard, 43% of children live in low-income families” (Koball & Jiang, 2018). While this data is dire, the good news is that there has been a slight decline of child poverty as the U.S. has recovered from the economic recession of the late 2000’s. In Table 7.6 “Number of Children in Poverty in the U.S., 2010 – 2016,” we can see a decrease in child poverty in every category.
Table 7.6 Number of Children in Poverty in the U.S., 2010 – 2016
|
|
2010 |
2016 |
|
Low Income |
33,216,701 |
29,842,412 |
|
Poor |
16,810,053 |
14,047,290 |
|
Deep Poverty |
8,139,897 |
6,193,661 |
Source: Data from Koball, H., & Jiang, Y. (2018). Basic Facts about Low-Income Children: Children under 18 Years, 2016. New York: National Center for Children in Poverty, Columbia University Mailman School of Public Health. Retrieved from http://www.nccp.org/publications/pub_1194.html
In the table above, data for low income children includes children living in households that are up to double the poverty threshold, while those in deep poverty are in households that are 50% of the poverty threshold or less (for instance if the poverty threshold in 2018 for a family of 4 is $25,100, this same family would be in “deep poverty” if their income was half this amount, or $12,550 or less). The data show that the percentage of low income children has declined by 4 percent, from 45% in 2010 to 41% in 2016. Similarly, while the number of children in poverty is still significant, it has dropped from roughly 23% to 21% in this same timeframe (Koball & Jiang).
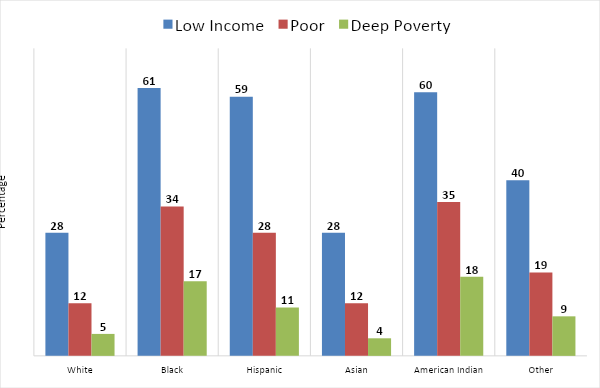
The rate of child poverty is the highest of any age group in the U.S. In comparison, the rate of poverty for adults aged 19 – 64 in 2016 was 13% and the rate for those over the age of 65 was 9%, or less than half of the child poverty rate (Koball & Jiang). Additionally, there are significant differences in child poverty rates when comparing diverse racial-ethnic groups in the U.S. Figure 7.10 “U.S. Child Poverty Rates by Race and Ethnicity, 2016” shows that the rates of poverty for Native American and African American children, at 35% and 34%, respectively, are roughly triple that of white children, whose poverty rate is 12%. Similarly, poverty among Hispanic children in the U.S., at 28%, is more than double the white child poverty rate.
Figure 7.10 U.S. Child Poverty Rates by Race and Ethnicity, 2016
Source: Data from: Koball, H., & Jiang, Y. (2018). Basic Facts about Low-Income Children: Children under 18 Years, 2016. New York: National Center for Children in Poverty, Columbia University Mailman School of Public Health. Retrieved from http://www.nccp.org/publications/pub_1194.html
The type of family structure also makes a difference, as does the educational and employment status of parents. Children who live with two parents are far less likely to live in poverty, compared to those children who live with one parent or in households where neither parent is present. Only 13% of children are in poverty in households where they reside with both parents. This is compared to one-parent headed households (predominantly female-headed), where 41% of children are in poverty and no parent households (often headed by grandparents), where 22% of children fall below the poverty line (Koball & Jiang). As this data indicates, families headed by single women are much more likely to be poor, thus, poverty has a female face (referred to as the ).
Additionally, the higher the level of educational attainment of parents and correlating employment stability, the less likely a child will be in poverty. As is apparent in Figure 7.11 “Percentage of Children in Low Income and Poor Families by Parent Education, 2016,” educational attainment plays a key role in the economic position of families and child poverty. In households where parents have some college education or more, only 11% of children experience poverty. This is compared to households where parents have only a high school degree or less than a high school degree, where 32% and 50% of children live in poverty, respectively (Koball & Jiang).
Figure 7.11 Percentage of Children in Low Income and Poor Families by Parent Education, 2016

Source: Data from Koball, H., & Jiang, Y. (2018). Basic Facts about Low-Income Children: Children under 18 Years, 2016. New York: National Center for Children in Poverty, Columbia University Mailman School of Public Health. Retrieved from http://www.nccp.org/publications/pub_1194.html
Comparing the U.S. rate of child poverty to other countries, we find that the poverty rate for U.S. children is the highest in the Western world and 1.5 to 9 times greater than the corresponding rates in Canada and Western Europe (Mishel, Bernstein, & Shierholz, 2009).

The poverty rate for U.S. children is the highest in the Western world. Wikimedia Commons – CC BY-SA 3.0.
Why is there so much more poverty in the United States than in its Western counterparts? Several differences between the United States and the other nations stand out. First, other Western nations have higher minimum wages and stronger unions than the United States has, and these lead to incomes that help push people above poverty. Second, the other nations spend a much greater proportion of their gross domestic product on social expenditures (income support and social services such as child care subsidies and housing allowances) than does the United States. As a recent analysis concluded, “Other peer countries are much more likely than the United States to step in where markets have failed to lift their most disadvantaged citizens out of poverty. This suggests that the relatively low expenditures on social welfare are at least partially implicated in the high poverty rates in the United States” (Mishel, Bernstein, & Shierholz, 2009, p. 387). In short, the United States has so much more poverty than other democracies in part because it spends so much less than they do on helping the poor.
Theories on Poverty
Explanations of poverty focus on problems either within the poor themselves or in the society in which they live (Iceland, 2006). The first type of explanation follows logically from the functionalist perspective of stratification and may be considered an “individual” explanation. The second type of explanation follows from the conflict perspective and is a structural explanation that focuses on problems in American society that produce poverty.
According to the individual explanation, the poor have personal problems and deficiencies that are responsible for their poverty. In the past, the poor were thought to be biologically inferior, a view that has not entirely faded, but today the much more common belief is that they lack the ambition and motivation to work hard and to achieve. According to the World Values Survey, 60% of Americans believe that people are poor “because they are lazy and lack will power.” This percentage reflects the tendency of Americans to favor individual explanations of poverty (Davidson, 2009).
A more sophisticated version of this type of explanation is called the (Banfield, 1974; O. Lewis, 1966). According to this theory, the poor generally have beliefs and values that differ from those of the non-poor and that doom them to continued poverty. For example, they are said to be impulsive and to live for the present rather than the future, thus are less likely to save or invest money. Critics say this view exaggerates the degree to which the poor and non-poor do in fact hold different values and ignores discrimination and other problems in American society (Iceland, 2006).
According to the second, structural explanation, U.S. poverty stems from problems in American society that lead to lack of equal opportunity. These problems include (a) racial, ethnic, gender, and age discrimination; (b) lack of good schooling and adequate health care; and (c) structural changes in the American economic system, such as the departure of manufacturing companies from American cities in the 1980s and 1990s (Iceland, 2003). These problems help create a vicious cycle of poverty in which children of the poor are often fated to end up in poverty or near-poverty themselves as adults. Thus, poverty is rooted in social and economic problems of the larger society rather than in the lack of willpower, laziness, or other moral failings of poor individuals themselves. Individuals born into poverty suffer from a lack of opportunity from their first months up through adulthood, and poverty becomes a self-perpetuating, vicious cycle.
Most sociologists favor the structural explanation, believing that poverty greatly blocks opportunities for success. Later chapters document racial and ethnic discrimination, lack of adequate schooling and health care, and other problems that make it difficult to rise out of poverty. On the other hand, some ethnographic research supports the individual explanation by showing that the poor do have certain values and follow certain practices that augment their plight (Small, Harding & Lamont, 2010). For example, the poor have higher rates of cigarette smoking (34% of people with annual incomes between $6,000 and $11,999 smoke, compared to only 13% of those with incomes $90,000 or greater (Goskowski, 2008)), which helps lead them to have more serious health problems. Adopting an integrated perspective, some researchers say these values and practices are in many ways the result of poverty itself (Small, Harding & Lamont, 2010). These scholars concede self-destructive behaviors exist, but they also say they exist because they help the poor cope daily with the structural effects of being poor, thus poverty becomes self-perpetuating. If poverty is both cultural and structural in origin, these scholars say, a comprehensive national effort must be launched to improve the lives of the people in the “other America.”
In order to achieve this goal, the perspective on poverty held by the majority must change. As sociologist Theresa C. Davidson (2009) observes, “beliefs about the causes of poverty shape attitudes toward the poor.” Research strongly suggests that public support for government aid for the poor is weak because so much of the public attributes poverty to failings among the poor themselves. If so, the public might very well begin to endorse greater government aid if its attribution for poverty became more structural instead of individual. Public education campaigns that call attention to the lack of opportunity and other structural problems that account for poverty thus might further poverty policy by beginning to change public perceptions of the poor.
The Effects of Poverty
However poverty is explained, it has important enduring effects, which later chapters will continue to discuss. For now, we can list some of the major consequences of poverty (and near-poverty) in the United States. As we do so, recall the sociological perspective’s emphasis on how our social backgrounds influence our attitudes, behaviors and life changes. This influence on life chances is quite evident when we look at some of the effects of poverty (Moore, Redd, Burkhauser, Mbawa & Collins, 2009; Iceland, 2006; D. Lindsey, 2009):
- The poor are at greater risk for family problems, including divorce and domestic violence. The stress of being poor is thought to be a major reason for these problems.
- The poor are also at greater risk for health problems, including infant mortality, earlier mortality during adulthood, mental illness and inadequate medical care. Many poor people lack health insurance. Poor children are more likely to have inadequate nutrition and to suffer health, behavioral and cognitive problems, and be exposed to environmental contaminants. These problems in turn impair their ability to do well in school and land stable employment as adults, helping to ensure that poverty will persist across generations.
- Poor children typically go to underfunded schools with inadequate facilities where they receive inadequate schooling. They are much less likely than non-poor children to graduate from high school or to go to college. Their lack of education in turn restricts them and their own children to poverty, once again helping to ensure a vicious cycle of continuing poverty across generations.
- The poor are, not surprisingly, more likely to be homeless than the non-poor but also more likely to live in dilapidated housing and unable to buy their own homes. Many poor families spend more than half their income on rent. The lack of adequate housing for the poor remains a major national problem that is only worsening.
Key Terms
Culture of Poverty Theory – a theory in which it is claimed the poor have beliefs and values that differ from the non-poor, and it is these beliefs and values that contribute to their poverty.
Economic Inequality – the extent of the economic difference between the rich and the poor.
Episodic Poverty – being poor for at least two consecutive months in some time period.
Feminization of Poverty – a phenomenon whereby women experience poverty at higher rates in comparison to men.
Poverty Line – A measure of official poverty calculated using data on food expenses and which is adjusted for family size.
Twice-Poverty or Low Income – family incomes below double the poverty line.
Continue to 7.5 End-of-Chapter Material
the gap between the richest and poorest segments of society
a measure of official poverty calculated using data on food expenses and which is adjusted for family size
family incomes below double the poverty line
occurs when individuals and families move into and out of poverty within a given year or two, often more than once
a phenomenon whereby women experience poverty at higher rates in comparison to men
a theory in which it is claimed the poor have beliefs and values that differ from the non-poor, and it is these beliefs and values that contribute to their poverty
