It is time now to take a closer look at families in the United States today. Using U.S. census data (U.S. Census Bureau, 2010), we first sketch the major types of family arrangements that now exist.
Marriage
The census defines a as being all the people who live together in a dwelling unit, whether or not they are related by blood, marriage, or adoption. About 117 million households exist in the United States. Of this number, about 67% are family households and 33% are nonfamily households. Most of the nonfamily households consist of only one person. About half of all households involve a married couple, and half do not involve a married couple.
This last figure should not suggest that marriage is unimportant. Only 26% of all adults (18 or older) have never been married, about 57% are currently married, 10% are divorced, and 6% are widowed (see Figure 12.3 “Marital Status of the U.S. Population, 2016, Persons 15 Years of Age or Older”). Because more than half of the never-married people are under 30, it is fair to say that many of them will be getting married sometime in the future. When we look just at people aged 45–54, about 88% are currently married or had been married at some point in their lives. These figures all indicate that marriage remains an important ideal in American life, even if not all marriages succeed.
Figure 12.3 Marital Status of the U.S. Population, 2016, Persons 15 Years of Age and Older
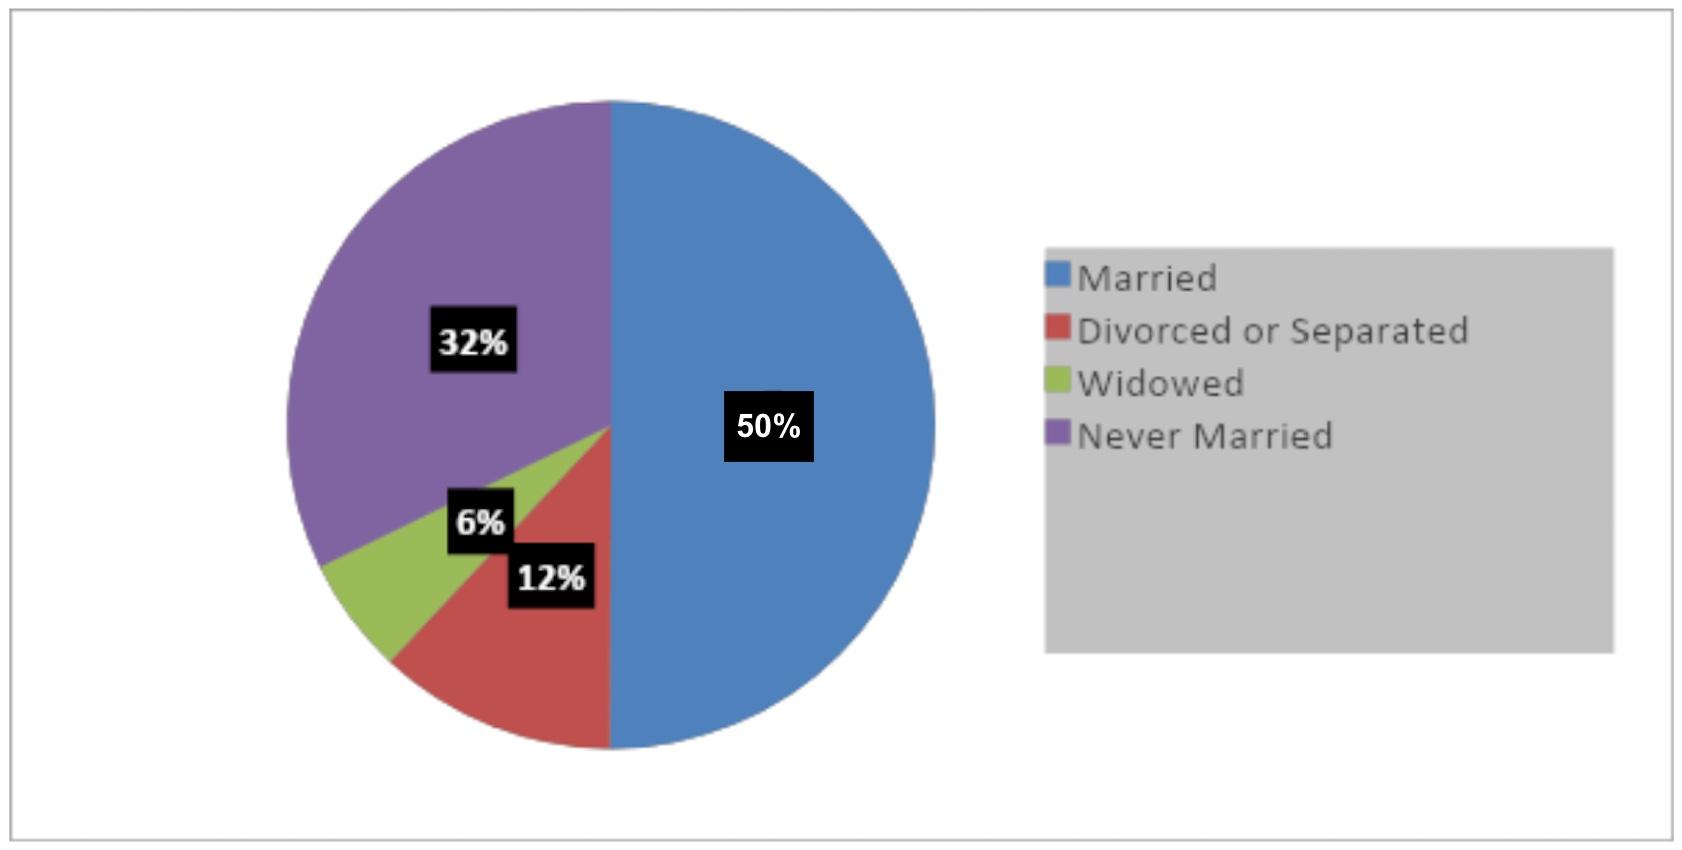
Source: Data from US Census Bureau. “Data.” Census Bureau QuickFacts, United States Census Bureau, 4 May 2018. Retrieved from https://www.census.gov/data/tables/2016/demo/families/cps-2016.html
Most married-couple households are , or between people of the same race or ethnicity. In 2016, only 10.2% of married-couple households were , or between people of different races or ethnicities (Rico, Kreider and Anderson, 2018). As small as it is, the rate of interracial and interethnic marriage is significantly greater than the 1.3% of marriages in 1980 that were classified as such. Moreover, in 2015, more than 17% of new marriages were interracial or interethnic. Rates vary by region, with 42% of newlyweds in Honolulu, Hawaii marrying across racial or ethnic lines, compared to the 3% of couples in Asheville, North Carolina and Jackson, Mississippi who did so (Alberti, 2017). In 2015, 29% of Asians, 27% of Latino, 18% of African American and 11% of white newlyweds intermarried (Alberti, 2017). There is variation when it comes to gender, with African American men being twice as likely to intermarry than African American women (24% versus 12%), while Asian Americans experience the reverse, with 36% of female Asian American newlyweds intermarrying, compared to the 21% of Asian American men who intermarried (Alberti, 2017). Rates of intermarriage are higher among people who are college-educated, live in metropolitan areas and are under the age of 50. The change in rates of intermarriage relates largely to increased diversity within U.S. society and increased acceptance of intermarriage within families.
Although only 3.9% of marriages are between people of different races, this figure is 3 times greater than the proportion of marriages in 1980 that were interracial. Jennifer Borget – CC BY-NC-ND 2.0.
It is interesting to see how the age at which people first get married has changed. Figure 12.4 “Median Age at First Marriage for Men and Women, 1890–2018” shows that age at first marriage declined gradually during the first half of the 20th century, before dropping more sharply between 1940 and 1950 because of World War II. It then rose after 1970 and today stands at almost 30 years for men and 28 years for women.
Figure 12.4 Median Age at First Marriage for Men and Women, 1890–2018

Source: Data from U.S. Census Bureau. (2010). Estimated median age at first marriage, by sex: 1890 to the present. Retrieved from https://www.census.gov/data/tables/time-series/demo/families/marital.html
The United States Compared with Other Postindustrial Nations
In many ways, the United States differs from other postindustrial democracies in its view of marriage and in its behavior involving marriage and other intimate relationships (Cherlin, 2010; Hull, Meier, & Ortyl, 2010). First, Americans place more emphasis than their postindustrial counterparts on the ideal of romantic love as a basis for marriage and other intimate relationships and on the cultural importance of marriage. Second, the United States has higher rates of marriage than other postindustrial nations. Third, the United States also has higher rates of divorce than other postindustrial nations; for example, 42% of American marriages end in divorce after 15 years, compared to only 8% in Italy and Spain. Fourth, Americans are much more likely than other postindustrial citizens to remarry once they are divorced, to cohabit in short-term relationships, and, in general, to move from one intimate relationship to another, a practice called .
The U.S. emphasis on romantic love helps account for its high rates of marriage, divorce, and serial monogamy. It leads people to want to be in an intimate relationship, married or cohabiting. Then, when couples get married because they are in love, many quickly find that passionate romantic love can quickly fade; because their expectations of romantic love were so high, they become more disenchanted once this happens and unhappy in their marriage. The American emphasis on independence and individualism also makes divorce more likely than in other nations; if a marriage is not good for us, we do what is best for us as individuals and end the marriage. As Andrew J. Cherlin (2010, p. 4) observes, “Americans are conflicted about lifelong marriage: they value the stability and security of marriage, but they tend to believe that individuals who are unhappy with their marriages should be allowed to end them.” Still, the ideal of romantic love persists even after divorce, leading to remarriage and/or other intimate relationships.
Families and Children in the United States
The United States has about 36 million families with children under 18. About 70% of these are married-couple families, while 27% (up from about 14% in the 1950s) are one-parent families. Most of these latter families are headed by the mother (see Figure 12.5 “Family Households With Children Under 18 Years of Age, 2016”).
Figure 12.5 Family Households With Children Under 18 Years of Age, 2016

Source: Data from US Census Bureau. “The Majority of Children Live With Two Parents, Census Bureau Reports.” Census Bureau QuickFacts, United States Census Bureau, 10 Apr. 2018. Retrieved from https://www.census.gov/newsroom/press-releases/2016/cb16-192.html
The proportion of families with children under 18 that have only one parent varies significantly by race and ethnicity: Latino, American Indian and African American families are more likely than white and Asian American households to have only one parent (see Figure 12.6 “Children in Single-Parent Families by Race, 2016”).
Figure 12.6 Children in Single-Parent Families by Race, 2016

Source: Data from “Children in Single-Parent Families by Race | KIDS COUNT Data Center.” KIDS COUNT Data Center: A Project of the Annie E. Casey Foundation. Retrieved from: https://datacenter.kidscount.org/data/tables/107-children-in-single-parent-families-by-race#detailed/1/any/false/870,573,869,36,868,867,133,38,35,18/10,11,9,12,1,185,13/432,431
We discuss single-parent families and racial and ethnic differences in family arrangements at greater length a little later, and we will also discuss several other issues affecting children. But before we leave the topic of children, it is worth noting that children, despite all the joy and fulfillment they so often bring to parents, also tend to reduce parents’ emotional well-being. As a recent review summarized the evidence, “Parents in the United States experience depression and emotional distress more often than their childless adult counterparts. Parents of young children report far more depression, emotional distress and other negative emotions than non-parents, and parents of grown children have no better well-being than adults who never had children” (Simon, 2008, p. 41).
Children have these effects because raising them can be both stressful and expensive. Depending on household income, the average child costs parents between $134,000 and $270,000 from birth until age 18. College education obviously can cost tens of thousands of dollars beyond that. Robin W. Simon (2008) argues that American parents’ stress would be reduced if the government provided better and more affordable day care and after-school options, flexible work schedules, and tax credits for various parenting costs. She also thinks that the expectations Americans have of the joy of parenthood are unrealistically positive and that parental stress would be reduced if expectations became more realistic.
Key Terms
Household — people who live together in a dwelling unit, whether or not they are related by blood, marriage, or adoption.
Interracial and Interethnic marriage (also called intermarriage) – a marriage between people of different races or ethnicities.
Intraracial or Intraethnic marriage — a marriage between people of the same race or ethnicity.
Serial monogamy — to move from one intimate relationship to another.
Continue to 12.4 Changes and Issues Affecting American Families
people who live together in a dwelling unit, whether or not they are related by blood, marriage, or adoption
a marriage between people of the same race or ethnicity
a marriage between people of different races
to move from one intimate relationship to another in a sequence
